

Cyprus
Microsoft Power BI, Zapier, Excel
eCommerce & Shopping
The project is about developing a Power BI-based Software Solution for a popular eCommerce and online shopping organization that has a mission of saving money for clients while buying online and help them choose the best shops, best deals, and discount coupons at their favorite online shops. It operates in the areas of Entertainment, Life & Lifestyle, Travel, Beauty & Fashion.
They were keen to design and develop a business intelligence solution that can enhance eCommerce and shopping activity by offering a variety of offers (best offers, available offers, latest offers), product comparisons, and a list of shops arranged alphabetically based on the chosen category. They also wanted to check the availability of coupons for use, based on personalized needs.
The client was finding it difficult to visualize the business requirement into a unified report to get a consolidated view of all the locations. They were looking for a business intelligence application that could offer its users a variety of feasible and effective options to shop from. It was getting tough to get a feel of what is happening online and the exact status of online shopping and eCommerce-related activities.
We developed an automation process to get & transform data using ADF/Logic Apps. This data was then used to develop a data warehouse following warehousing standards and later, to develop Power BI Dashboards along with mail alerts.
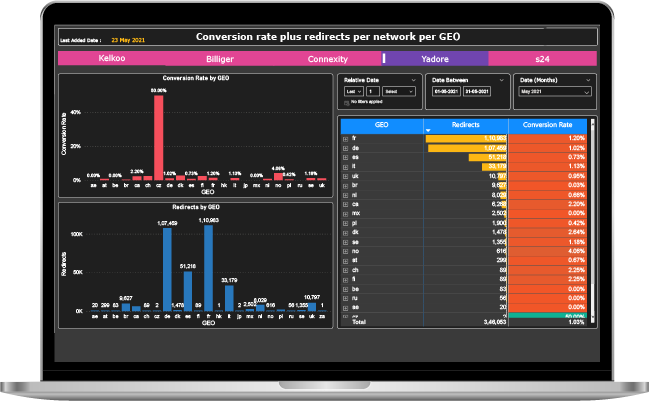
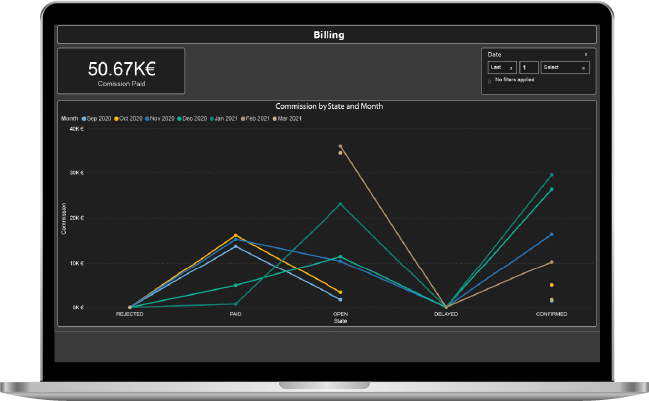
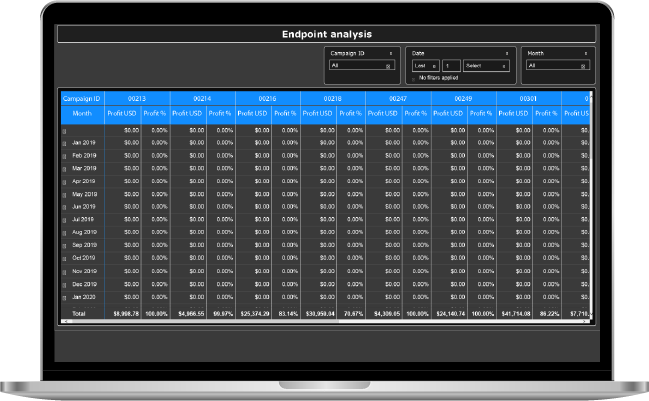
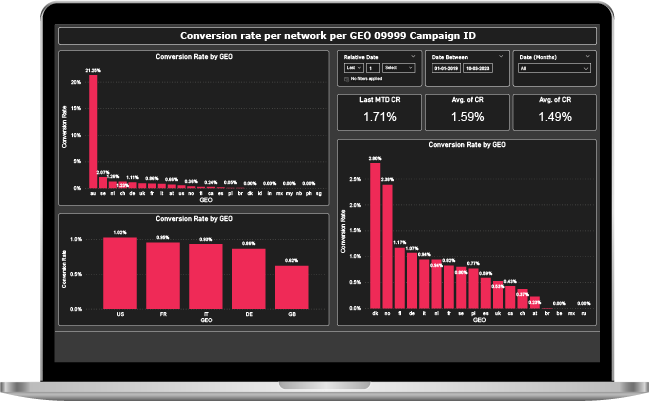
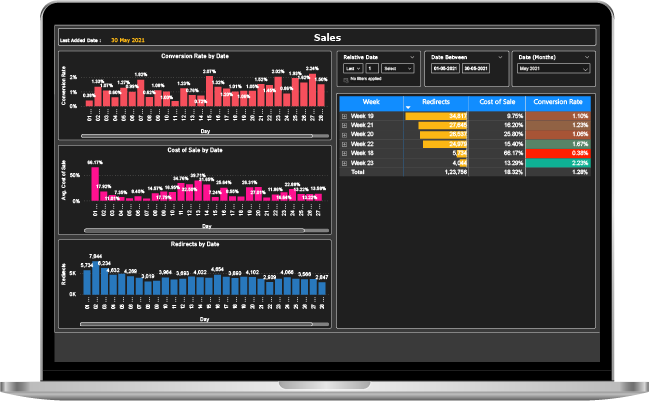
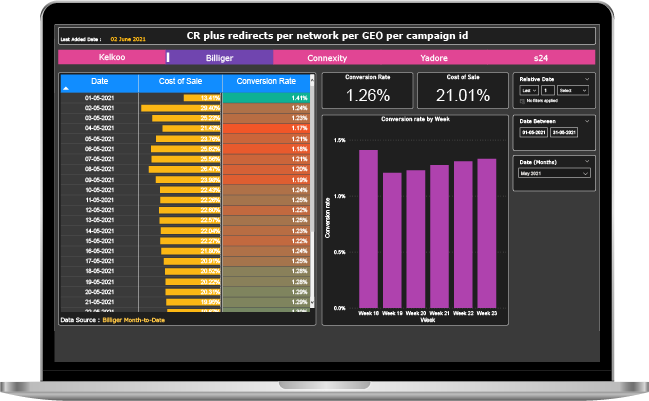
This project provides the performance of marketing campaigns by viewing impressions and clicks, based on KPIs from the Power BI report. Using Zapier, we developed Zaps for the automation of data gathering. Using Google Drive and API as a data source, we created multiple dashboards like the Performance dashboard, Billing dashboard, Endpoint analysis dashboard, etc. The history of data files lies in Google Drive, which synchronizes with the local system folder to import data into Power BI.
Commission by state and month
Commission payments and rejections per campaign
Master file download, creation, and update
Billing dashboards
XML Endpoint analysis dashboard
Wholesaler SOH
Profitability of media buying campaigns
Discrepancy in clicks/External partner clicks
Revenue per click per merchant

SPEC House, Parth Complex, Near Swastik Cross Roads, Navarangpura, Ahmedabad 380009, INDIA.

This website uses cookies to ensure you get the best experience on our website. Read Spec India’s Privacy Policy