


Our Comprehensive Data Visualization Service Offerings
Make the most of your data silos by unlocking different ways of data visualization and analysis to achieve your business goals. Our advanced data visualization services enable us to convert raw data into comprehensible formats regardless of data type. Declutter huge volumes of data for better monitoring, prediction, and opportunity realization to enhance the decision-making process.
Data Visualization Consulting
Our data visualization consulting services are intended to help you transform data into a form that can easily be perceived and utilized. We assist you in selecting the appropriate data visualization tools and developing vivid and interactive visuals to make your data worthwhile. Our data visualization consultants in data visualization will walk you through the process to ensure the solution you get will better support your business decisions.
Custom Dashboard Development
No two businesses are the same, and therefore, the dashboard should be personalized. We design an operational dashboards so that you know precisely what is relevant to your business. Our data visualization specialists create powerful dashboards using powerful business intelligence tools that are simple to navigate and comprehend. Want to visualize your data in a way nobody has done before? Get data visualization experts on our team, and they will make something that fits perfectly.
Data Visualization Optimization
Not only interpreting data in natural language but also real-time analysis of high-volume data, our data visualization consultant leverage AWS, Azure, Google Cloud, and more for channelizing the data silos into the dashboard from various cloud sources. We make facilitate the business to integrate high-volume data from various courses in the cloud into a single custom dashboard to drive the ease of decision-making for businesses.
Data Analytics and BI Platform Development
Our data analytics and visualization services assist your business in unifying all its data in one place. Our group creates robust business intelligence systems that use your data to create informative charts, graphs, and dashboards. We are a trusted data visualization company and will be able to help you easily cognize trends, monitor performance, and make wise decisions. This is the reason why people put their confidence in us as one of the best data visualization companies.
Data Visualization Implementation
Our team does all the work of data visualization implementation, including planning and going live. We ensure that you have the right things in the right place so you will get the best out of your information. Being a well-established data visualization consulting company, we aim to assist you in developing user-friendly, interactive visual tools to suit your business strategy-making processes. It is our task to ensure that you use your data in the greatest way possible without putting much effort into it.
Data Visualization with Cloud Services
Wish to access your data at any time, from any place? Our data visualization services are cloud-based and are interoperable with platforms such as AWS, Azure, and Google Cloud. Being a cloud-first data visualization company, we assist you with accessing real-time insights regardless of your location. Your team will be able to remain connected and make fast decisions by using secure and flexible data visualization solutions, without having the risk of being tied to a place.
Dashboard Development and Optimization
We create and enhance interactive dashboards that provide you with a clear picture of your business so that you can monitor performance, measure performance, and identify opportunities. Our data visualization consultancy services ensure that the dashboards you have in mind or are using are usable and give you the insight that you need. Whether it’s developing dashboards from scratch or enhancing existing ones, we help create dashboards that visually support better decision-making.
BI Tools Implementation and Migration
Thinking about switching to Power BI, Tableau, or another BI tool? We're here to help. Our team offers smooth BI tools implementation and migration so you can get up and running quickly. As trusted data visualization service providers, we make sure your move is easy and your tools work the way you need. Our data visualization consultants handle everything with care, making us one of the top data visualization consulting firms you can count on.

Unlock the Power of Your Data
Learn how data visualization can improve your business strategy.
SPEC INDIA’s data visualization services can help your business to leverage business intelligence for data-backed business decisions. We help businesses visualize patterns, trends, and business opportunities from your data silos. Let Your Data Talk for You.
-

Power BI
-
Tableau
-
Pentaho
-
SSRS
-
Excel
-
Logi Composer


-

ADF
-
PDI
-
AWS Glue
-
Hevo
-
SSIS


-
SQL Server
-
Azure Synapse
-
Redshift
-
MySQL
-
Snowflake
-
PostgreSQL


Our Numbers Speak for Us
1000+
Projects Delivered96%
Enterprise Client Retention200+
Happy Clients35+
Countries Served15+
Years of Average Client Engagement4.8/5
Satisfaction RatingWhy Utilize SPEC INDIA’s Data Visualization Services?
Unlock silos of information to drive transformation for your business with improved decision-making powers. These data visualization services help businesses irrespective of niches to better organize data for better breakdown and understanding of data.
Curtail Spreadsheets Requirement01
Eliminate the requirement of dozens of frustrating spreadsheets for data tracking and reporting for your business. Make data decoding easier with better visual representation using advanced data visualizations of real-time data to help foresee business opportunities.
Easy Complex Data Interpretation02
Unclose the previously invisible patterns to formulate valuable insights, recognize relationships, and give greater meaning to the data silos with data visualization strategies. The tables, charts, maps, graphs, and more enable the user to easily digest huge volumes of data.
Efficient Data Filtration03
Uncover the crucial components or details of the data coming from various sources by the users or departments of your organization through dedicated dashboards. Our data visualization consulting enables users to have a different perspective of the data by channeling it.
Customized Reports04
Reports are a crucial aspect of any organization and maintain the pace of productivity consistently in every department. The customized reports allow the C-suite manager and experts to track the KPIs effectively and realize the factors affecting productivity or business growth.
Foresee Emerging Trends05
Escalate business profits by recognizing the market shifts for the benefit of the business. Data visualization enables leveraging the emergence of trends by taking a closer look at the fluctuating patterns of data in dashboards and hence eliminating the consequences of a failed strategy.
Stamp Out Bottlenecks06
To rectify mistakes, identifying erroneous data is crucial. We are data visualization service providers enabling businesses to have a clear picture of data silos. The enhanced interactive data visuals help to eliminate erroneous data from the following data sets.
Hire Data Visualization Developers
Want to see your data in a clear and simple way? Our data visualization experts at SPEC INDIA can help you turn complex data into easy-to-read charts, dashboards, and reports. We work with you to understand your goals and create visuals that help you make better business decisions.
Speak To Our Experts
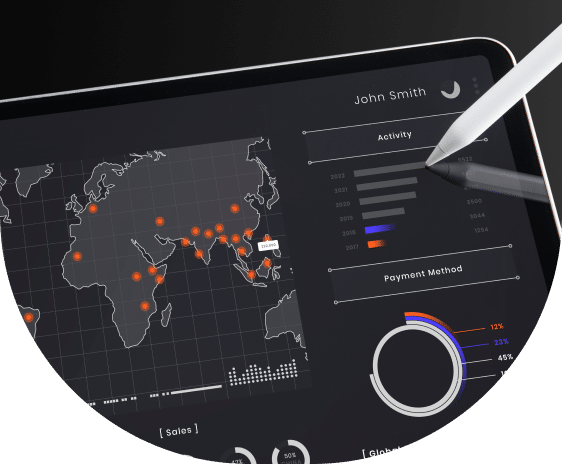
Our Live BI Visualization for C-Executives
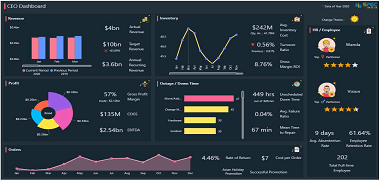
Data Visualization Solutions We've Created for Businesses Like Yours

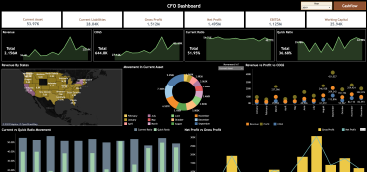
The Power BI dashboard is designed to be used by a client who is in charge of the retail store establishments in airports, ferries, and other places around the globe. It provides a simplistic account of the income and expenditure, which assists the management in monitoring the financial efficiency of departments. The dashboard assists in making quicker and wiser decisions about business with detailed reports on Profit & Loss and Expenses with Month-on-Month and Year-on-Year comparisons.
Explore More
The comprehensive retail dashboard built using Power BI consists of all the crucial analytics and metrics that are of much significance to the retail business and provides wider visibility. The live dashboard has been divided into various sections, such as sales, profit, orders, and shipping, and the details on the dashboard portray drill-down data with enhanced forecasting and time-saving effectiveness.
Explore More
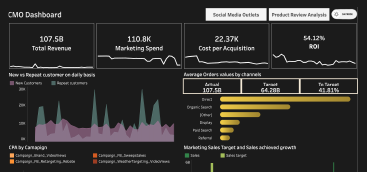
This Power BI dashboard monitors the company's performance through platforms such as Facebook, Twitter, and LinkedIn. It assists in audience sentiment, topics that are popular at the given moment, and the effectiveness of the campaign. Marketers can leverage it to increase engagement, increase conversion rates, and build brand awareness. It is easy to understand and use, but provides not only statistics, but also helps make decisions wiser.
Explore More
This Power BI dashboard provides a hospital with a full picture of patients as well as patient demographics, clinical data, and department-wise data. It assists in monitoring important indicators such as ICU patients, re-admissions, average days to discharge, and the number of patients by age, gender, and place. It helps one to make prompt decisions based on data due to their time, hospital, department, and patient details filters.
Explore More
This hospitality industry dashboard (hotel dashboard) is a depiction of data from different hotels in two countries- the US and India. This is a rich, interactive, and visually attractive hotel report comprising hotel occupancy status, customer satisfaction with the hotel based on reviews by value plus, ratings by location, food, facilities, and hospitality.
Explore More
A food waste management dashboard is an interactive data visualization tool designed to monitor, analyze, and optimize food waste across operations. It helps businesses track food loss in real time, identify major waste sources, analyze cost impact, and support sustainable decision-making. The dashboard offers detailed insights into waste trends, inventory inefficiencies, and cost-saving opportunities.
Explore MoreIndustries We Serve
Discover the diverse range of industries we proudly support with our innovative software solutions to companies of different business verticals. Our expertise spans multiple sectors, ensuring tailored services for every unique need.


Frequently Asked Questions
Data visualization transforms raw data into actionable insights, helping you identify trends, optimize operations, improve decision-making, and gain a competitive edge.
We have expertise in data visualization, consulting, and custom dashboard creation across industries, including healthcare, fitness, finance, retail & eCommerce, manufacturing, and supply chain & logistics, tailoring solutions to meet industry-specific challenges.
Some of the best data visualization tools are:
- Microsoft Power BI
- Tableau
- Qlik Sense
- Qlikview
- Looker
- Zoho Analytics
- Google Charts
The list does not end here; there are numerous tools that businesses can leverage according to the data visualization requirements.
The timeline depends on the complexity of the project, but we follow an agile approach to deliver incremental results, ensuring quick wins and continuous improvement.
There is no fixed amount of dashboard development. There are a variety of factors that affects the overall cost of dashboard development for different projects like the scope of the project, complexity, cost of hiring a data visualization consultant, and more. The business can consider these factors to estimate the approximate cost of dashboard development.
SPEC INDIA is a top-tier data visualization service provider with decades of industry experience. We follow a well-crafted, step-by-step process to deliver impactful visualizations:
- Understanding Your Business Needs: We begin by collaborating with you to identify key objectives, challenges, and goals to ensure the visualization aligns with your business strategy.
- Data Collection: We gather relevant data from multiple sources, ensuring accuracy and completeness for a strong foundation.
Data Cleaning: Raw data is processed to remove inconsistencies, duplicates, and errors, ensuring high-quality inputs for analysis. - Data Modeling: We structure and organize the data into meaningful relationships, enabling efficient analysis and visualization.
- Selecting the Right Visualization Tools: Based on your requirements, we choose the most suitable tools and technologies, such as Tableau, Power BI, QlikView, D3.js, or Python libraries like Matplotlib and Seaborn, to create dynamic and interactive visualizations.
- Designing Interactive Dashboards: Our team designs intuitive and visually appealing dashboards that make complex data easy to understand and explore.
- Delivering Actionable Insights: We provide clear, actionable insights that empower your team to make data-driven decisions and achieve business goals.
Businesses can opt for data visualization techniques based on data format/type and visualization goal. Here are some of the best data visualization techniques that companies can utilize:
- Charts
- Tables
- Graphs
- Maps
- Plots
- Infographics
- Diagrams
- Dashboards
- Matrices
We leverage advanced data processing and modeling techniques and tools like Apache Spark, SQL databases, and cloud platforms (AWS, Azure, Google Cloud) to efficiently manage and visualize large datasets.
Absolutely. We use APIs, ETL pipelines, and middleware solutions to ensure seamless integration with your existing systems, whether they’re CRMs, ERPs, or custom databases.
Yes, we design real-time dashboards using tools like Power BI, Tableau, and custom-built solutions to help you monitor live data and make instant decisions.
To protect your data throughout the visualization process, we follow strict data security protocols, including encryption, access controls, and compliance with regulations like GDPR, HIPAA, and CCPA.
Let’s get in touch!
India
SPEC House, Parth Complex, Near Swastik Cross Roads, Navarangpura, Ahmedabad 380009, INDIA.
-
 +91-79-26404031, 32-33-34
 -
 [email protected]
