

Dashboard Overview
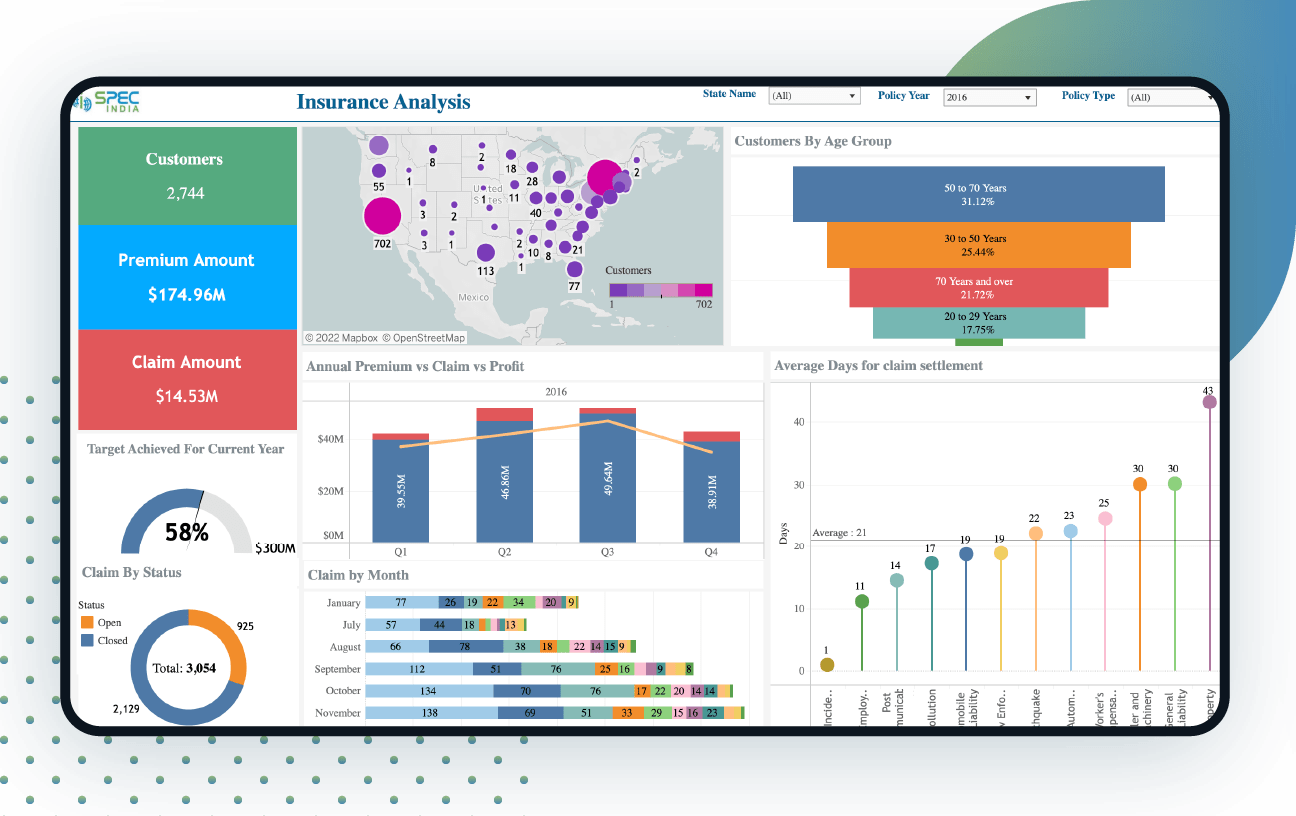
This insurance dashboard shows customers by age group along with gender percentage, policy type, and years. They can also compare yearly status and observe the time taken for different types of claim settlements.
The annual premium vs claim vs profit analysis displays the company’s overall progress. It also shows how many claims are open and closed. The month-wise claim section with description and count allows insurance companies to access granular data, helping mid-management to identify opportunities and weaknesses.
This information-rich dashboard offers an at-a-glance view to help ease the decision-making process, formulate growth strategies, and extract insights based on the data.
Note: This is Tableau Data Representation for insurance companies.
Live Dashboard
Disclaimer: The data, characters and brand names depicted in the visualizations are for demo purposes only. Any resemblance to actual data, or to brand names, is purely coincidental.
Main Features
Claims monitoring
Claims Trends
Financial Metrics
Data Analysis by Age, Gender, and Policy Type
Patient Demographics
Policy Performance
Utilization Rates
Risk Assessment
Annual Premium vs Claim vs Profit Tracking

Similar Project Idea?
Unleash the Potential of Business Intelligence with our BI Developers Showcasing Technically Superior Skills
Submit RequestGoals
Our goal with the Healthcare Insurance Analysis Dashboard was to cater to a wide range of stakeholders within the insurance industry. We aimed to provide critical insights that improve operations, manage risks better, and support strategic planning.
Objectives
Provide insights for tracking overall progress and monitoring key performance indicators.
Facilitate easy assessment of customer data and claim status to boost satisfaction.
Enable trend observation in claim settlements for informed strategic planning.
Target Audience
Insurance Company Executives and Senior Management
Claims Department
Underwriting Team
Sales and Marketing Teams
Risk Management and Actuarial Teams
Customer Service and Support Teams
KPIs
Total Customers
Total Claim Amount
Total Premium Amount
Target Achieved in Current Year
Total Claims by Status
Total Client by State
Annual Premium vs Claim vs Profit
Total Claims by Month and Claim type
Average day Claim Settlement for specific Claim type
More Live Visualisation


Looking For Something Similar?
We have worked with some of the best innovative ideas and brands in the world across industries.
Contact UsLet’s get in touch!
India
SPEC House, Parth Complex, Near Swastik Cross Roads, Navarangpura, Ahmedabad 380009, INDIA.
-
 +91-79-26404031, 32-33-34
 -
 [email protected]
