

What Is Super Store Dashboard?
A perceptive Tableau Superstore dashboard offers a high-level view of the operational data from a superstore having multiple branches all over. As a small retail segment, it could be producing multiple products like technology products, office products, furniture, etc. Clients could belong to individual segments or business consumers like organizations or home offices.
The Store performance dashboard helps businesses in decision-making, saving time and money by extracting data directly from relevant data platforms.
The dynamic Superstore Tableau dashboard offers a range of filters with a drill-up and drill-down facility for better in-depth analysis. It can determine the total amount of sales, profit, and orders for a selected region. Filters will be applied to different visualizations, as needed.
Live Dashboard
Disclaimer: The data, characters, and brand names depicted in the visualizations are for demo purposes only. Any resemblance to actual data, or to brand names, is purely coincidental.
Main Features
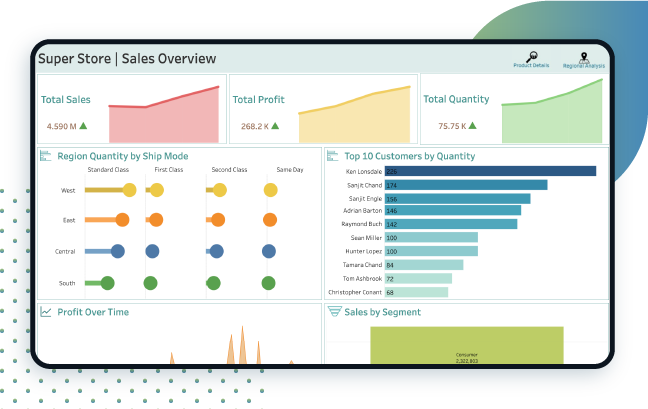
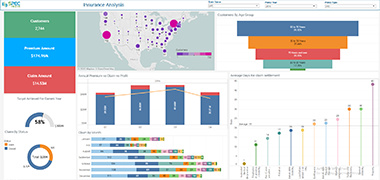
Total sales, total profit, and total quantity are displayed in the area chart
Region quantity by ship mode through all regions
Top 10 customers by quantity in the bar chart
Yearly profit over time as area-trend chart
Sales by segment (consumer, corporate, home,office)
Funnel showing highest consumer segment to lowest home office segment
Sales by category with the bar chart
Top 5 product sales in a tabular format
Sales by subcategory market basket including a comparison of current subcategory percentage with others
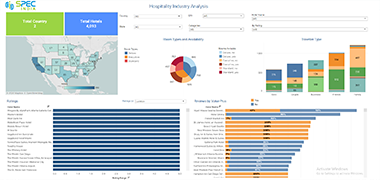
Sales by regions
Top 10 cities by sales, as a bar chart showing total sale and percentage
Tracking of top 10 cities, region-wise, comparing ranks of last two years
Current to previous year comparison, with top 10 cities

Tableau Super Store Dashboard To Assist Management in Intuitive Decision Making
Leverage the insightful, store performance dashboard to undertake appropriate decisions in marketing, sales, and production. Move a step further of the rest by widening business horizons and maximizing revenue.
Get Set GoGoals
This Superstore performance dashboard focuses on comparing a range of data simultaneously so that decisions can be taken with ease and efficacy. The Tableau dashboards help in finding out the ups and downs in sales, shipping, and profits, and extracting the problem areas, for smooth progress.
Objectives
Drill-down functions to get comprehensive insights for superior strategies
Visually appealing and enriched dashboard for directors and business leaders
Visualization, tracking, and reporting of crucial KPIs and metrics
Audience
Business team
Business director
Superstore administrators, managers
Corporations
Home offices
Board of directors
KPIs
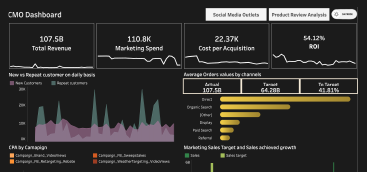
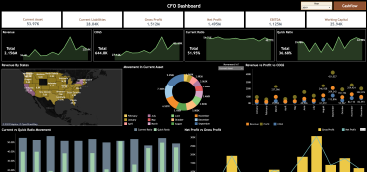
Total sales and profit figures
Total marketing spends
Monitoring long-term company strategy
Data created and used by analysts
Cost Per Acquisition (CPA)
Return On Investment (ROI)
Click Through Rate (CTR)
Cost Per Click (CPC)
Number of clicks, posts, likes
Conversion rates
Organic search
Return on marketing/advertising spend
Sentiment Analysis
Page Views
More Live Visualizations


Generate Pioneering Superstore Dashboards For Your Business
Allow us to understand your business intelligence needs and we will build a Superstore Tableau Dashboard customized to suit your demands.
Contact UsLet’s get in touch!
India
SPEC House, Parth Complex, Near Swastik Cross Roads, Navarangpura, Ahmedabad 380009, INDIA.
-
 +91-79-26404031, 32-33-34
 -
 [email protected]
