

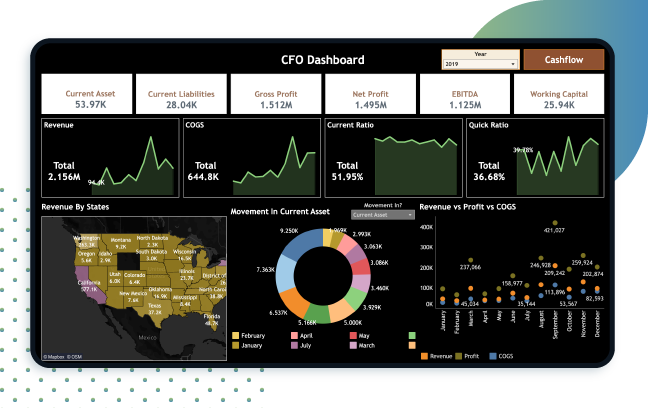
What Is CFO Dashboard?
The CFO dashboard houses visual KPIs that help financial officers make data-driven decisions based on a broad range of financial information available. With a panoramic view of all the financial measures such as net profit, revenue, current ratio, COGS, EBITDA, working capital, quick ratio, and cash flow, this dashboard serves as a central repository for all insights.
Using this financial dashboard, CFOs can see year wise financial performance of the company, access financial and fiscal information, revenue by geographic location, revenue vs profit vs COGS, Net profit vs Gross profit, and so on.
It includes year-wise performance, revenue by location, movement in assets, comprehensive details of cash flow with categories, consolidated actual vs forecasted cash positions, and many more details. With the easy-to-understand visualization, it helps CFOs create some meaningful strategies and set financial goals to be achieved.
Live Dashboard
Disclaimer: The data, characters, and brand names depicted in the visualizations are for demo purposes only. Any resemblance to actual data, or to brand names, is purely coincidental.
Main Features
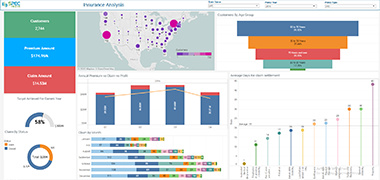
Total revenue, current ratios, quick ratio, and COGS( Cost of Goods Sold) value displayed in graph charts
Real-time values showing current assets, liabilities, gross & net profit, capital, and EBITDA (Earnings Before Interest, Taxes, Depreciation, and Amortization)
Revenue by states with outliers highlighted in different colors using Map View.
Measure month-wise movements in Working Capital, Current Asset, Current Liabilities, and EBITDA by selecting a value from the dropdown
Compare Revenue vs Profit vs COGS to see the profit margin and revenue with the highest profit and lowest values month-wise
The current vs quick ratio movement displays liquidity ratios that help financial analysts measure a company’s ability to meet financial goals
Net profit vs Gross profit is displayed in a bar and line graph to gauge actual profit for each month
Cash flow dashboard to track cash flow movements of the company with every spending, income, and cash
Monitor the company’s inflow, operating cash, and net investing cash flow performance over a period of time
Account payable and receivable through pie chart helps get insights into short-term liabilities and expected funds
Track cash flow operations by categories and adjust your view by selecting the year value from the top right corner of the view
Determine whether the actual value meets the forecasted values or not for cash positions along with monthly data points

Financial Dashboard To Monitor Business Health
Centralize all financial data to monitor trends, oversee financial parameters, and get real-time, actionable insights to strengthen the financial performance of your company.
Get StartedGoals
This CFO financial dashboard is designed with all the important finance KPIs in one place to help chief financial officers (CFO) monitor the financial overview of the company and overall performance. You can track parameters such as revenue, profit, cash flow, COGS, capital, and comparisons between them.
Objectives
Drill-down functions to get detailed insights for better strategies
Visually appealing and data-rich dashboard for directors and CFOs
Visualize, track, and report on critical financial metrics
Customizable KPIs aligned with business strategy
Forecasting and variance analysis for better budgeting decisions
Integration with ERP, CRM, and financial systems for a single source of truth
Performance benchmarking across regions, periods, or business units
Secure, user-friendly access for decision-makers anytime, anywhere
Audience
CFOs
Finance director
Finance team
Board of directors
Owners/CEOs
Financial Analysts
Controllers
Financial Managers
Corporate Treasurers
Business Analysts in Finance
Financial Planning & Analysis (FP&A) teams
KPIs
Revenue by State
Movement in Current assets
Revenue vs Profit Vs COG
Current Vs Quick Ratio Movement
Net vs Gross Profit
Operating cash inflow and outflow
Account Payable and Receivable Turnover
Cash flow from operations by Categories
Consolidated Actual and Forecast Cash Positions


Build CFO Dashboards For Your Company
Tell us your requirements and we build a CFO dashboard that is customized as per your unique needs.
Contact UsLet’s get in touch!
India
SPEC House, Parth Complex, Near Swastik Cross Roads, Navarangpura, Ahmedabad 380009, INDIA.
-
 +91-79-26404031, 32-33-34
 -
 [email protected]
