

Dashboard Overview
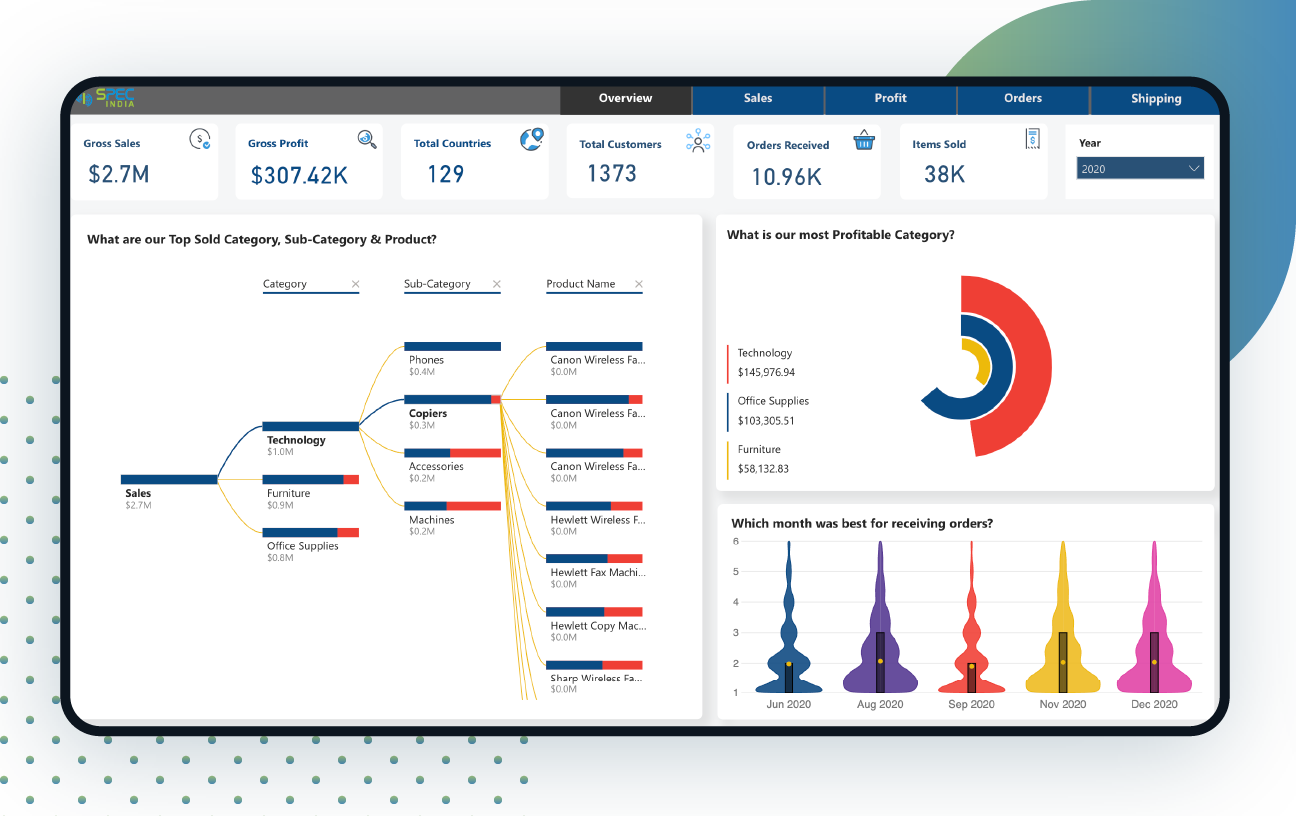
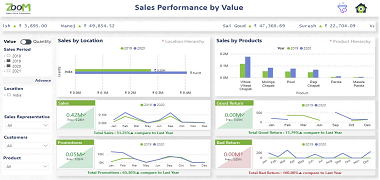
The enriched retail dashboard overview offers a detailed, real-time view into the summary of major parameters like gross sales and profit, total countries served, the best month for receiving orders, and items sold in a particular year. The retail analytics dashboards offer an effective data visualization experience, with all required information in a single go, based on category, sub-category, and product.
The dashboard offers robust Power BI row-level security features that control the access to rows and implements restrictions, based on user privileges and authentication. Specific security roles and role-based filters can be defined within the dashboard, to ensure effective row-level security.
Live Dashboard
Disclaimer: The data, characters and brand names depicted in the visualizations are for demo purposes only. Any resemblance to actual data, or to brand names, is purely coincidental.
Main Features
Sales: Region and category-wise sales, top countries where the sale is highest, top-performing products, and month-wise sales trend.
Profits: Monthly profits, profitable/unprofitable regions, category/sub-category wise profits, most profitable customers
Orders: Details of orders received category and sub-category wise, location and segment-wise, customers who ordered most, the effect of orders received on profits.
Shipping: Shipping details like the cost for shipping, customer preference, and locations where products were shipped, the average cost of shipping as against total shipment.

Similar Project Idea?
Unleash the Potential of Business Intelligence with our BI Developers Showcasing Technically Superior Skills
Submit RequestMore Live Visualization


Looking For Something Similar?
We have worked with some of the best innovative ideas and brands in the world across industries.
Contact UsLet’s get in touch!
India
SPEC House, Parth Complex, Near Swastik Cross Roads, Navarangpura, Ahmedabad 380009, INDIA.
-
 +91-79-26404031, 32-33-34
 -
 [email protected]
