

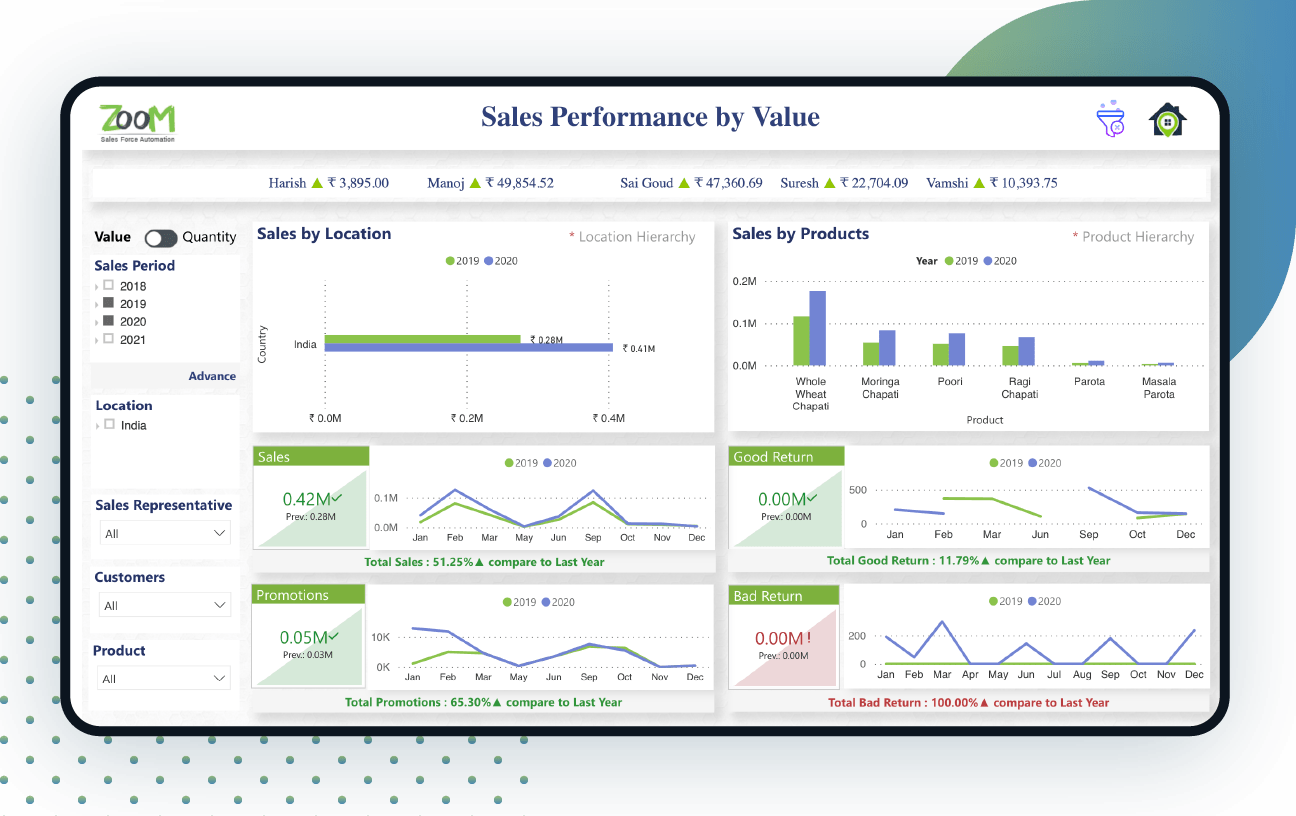
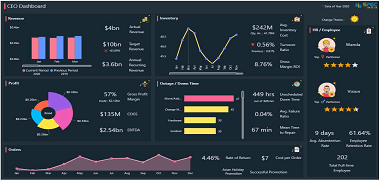
Sales Performance Dashboard Overview
A variety of sales measures are indicated based on two major categories – ‘Sales Performance by Value’ and ‘Sales Performance by Quantity’. The top of the sales team performance dashboard shows continuously moving information displaying the name of the sales representatives with the latest sales figures. If you select a particular sales representative, entire data pertaining to that person will be displayed.
Different filter categories like sales period, sales location, customers, and product are used to extract relevant information. If there is no filter selected, by default, it shows data of the last four years’ YTD, including the current year. The sales period can be chosen as either of the last 4 years, all of them, or you can choose a period for showing the data. The whole report can be filtered using a date hierarchy (Year -> Quarter -> Month -> Week -> Day).
Major Highlights Of Sales Performance Dashboard Power BI:
- Overview of sales KPIs
- Granular information for sales/good return sales/bad return sales/promotion sales
- Drilldown customer/item/location/employee wise sales
- Value and quantity-wise sales
Business Benefits
- Best suited for businesses who need a complete overview of sales performance at a single go
- Offers 360-degree sales monitoring with an effective graphical display
- Data-driven visualization provides is useful in making optimal business decisions
- Helps in exploring data and analyzing customer/product trends
- Showcases details of value and quantity through enriched yearly data-driven visualization
- Easy to use and effective in finding out the best promotions, offers, and most saleable product
- Displays products that have fewer sales and need more focus, especially goods returned and associated reasons
Live Sales Performance Dashboard
Disclaimer: The data, characters and brand names depicted in the visualizations are for demo purposes only. Any resemblance to actual data, or to brand names, is purely coincidental.
Power BI Sales Dashboard Main Features
Sales By Location
Location wise yearly sales figures are displayed as horizontal bars, for a period chosen from the listed four years. If no option is selected, the display will be for all four years. There is a drill-down feature that facilitates viewing of detailed information based on hierarchy (Country -> Zone -> State -> City -> Area -> Route).
Sales By Products
Product-wise sales data is displayed based on item hierarchy, with the drill-down facility (Item category -> Item subcategory -> Item), for the period selected. As you hover over the bars, it shows a picture of the item indicating its sale has increased or decreased.
Sales
Showcases overall sales figures, month-wise, for the number of years selected, in the form of a line graph.
Promotions
Displays promotions sales data, month-wise, for the selected time. Currently, only free item quantity has been considered. It can be customized as per need.
Good/Bad Return
Shows good/bad return monthly sales information, based on years selected.

Similar Project Idea?
Unleash the Potential of Business Intelligence with our BI Developers Showcasing Technically Superior Skills
Submit RequestMore Live Visualization


Looking For Something Similar?
We have worked with some of the best innovative ideas and brands in the world across industries.
Contact UsLet’s get in touch!
India
SPEC House, Parth Complex, Near Swastik Cross Roads, Navarangpura, Ahmedabad 380009, INDIA.
-
 +91-79-26404031, 32-33-34
 -
 [email protected]
