

Mastering KPI Dashboards: How Modern Companies Use Data to Drive Strategy and Results?
Data plays a crucial role in helping business owners make informed decisions. But when you have data at hand and are unsure how to use it, it becomes a challenge.
Just like yours, every other organization still struggles because they have data available, but they see minimal improvement and no data-driven insights. Additionally, data show that more than 60% of enterprises have an initial data strategy roadmap but still struggle to make decisions. On the other hand, companies with real-time analytics are seeing a 29% improvement in decision-making and a 21% reduction in operational costs. It shows the impact clarity and the right tool can have.
All thanks to KPI dashboards that act as a light in the dark. When you have a well-structured Key Performance Indicator dashboard, you can expect more than data visualization. All the performance-backed numbers are presented in an interactive view. It will help you get clarity on what is happening currently and how much it matters to your business. More than 85% of enterprises highly depend on dashboards to track performance.
Given the importance of a KPI dashboard, is good development enough? A strategy aligned and customized to their users is a key consideration.
In our comprehensive guide, you can expect:
- Meaning and importance of the KPI dashboard
- KPI dashboard best practices to ensure impactful delivery
- And use cases + real-world KPI dashboard examples.
What is a Key Performance Indicator (KPI) dashboard?
A KPI dashboard is an interactive platform that visually represents business performance to understand progress. With modern dashboards, you can expect a simple, intuitive layout of complex data, actionable insights that explain what is happening and why, and clear signals of what needs attention.
This directly indicates a clear difference between traditional and modern dashboards. The following are some core differences that you, as a business owner, must look into:
- Real-time or near real-time
- Interactive meaning allowing for drill-down into deeper data
- Offers contextual information and comparisons
- Provides insights that help in decision-making
Such data helps stakeholders understand the hidden patterns and trends. Modern KPI dashboards are often built using industry-leading BI tools such as Power BI or Tableau. It allows organizations to combine powerful data modeling with interactive, real-time visualization.
Who Needs a Key Performance Indicator Dashboard? Use Cases
KPI dashboards serve every department and team, enabling every role to extract valuable insights. Here is an audience-wise use case for each role.
-
Executives
KPI dashboards help leadership teams to stay aligned on strategic goals. C-suite-level professionals gain access to revenue, growth, customer satisfaction, and overall business health.
-
Product Managers
Product teams track user behavior, adoption trends, funnel performance, and retention. With the KPI dashboard, they can prepare the roadmap for the area that requires the most attention.
-
Operational Leaders
The ops team’s priority is to make the process efficient, optimize resource utilization, and ensure SLA compliance. With the Key Performance Indicator dashboard, you can detect workflow challenges and keep operations running seamlessly.
-
Marketing & Sales Teams
If you want your team to focus on strategies such as pipeline movement, campaign performance, conversion rates, and ROI, the KPI dashboard is a worthwhile investment. It highlights areas where resources and budget are wasted.
-
Engineering & DevOps Teams
A KPI dashboard is a valuable tool for engineering and DevOps teams to monitor system reliability, uptime, incident patterns, and team velocity. They aim for stability and continuous improvement.
Since multiple teams rely on KPI dashboards for strategic decisions, the dashboard is more than just a tool. It entirely shapes an organization’s perspective towards challenges or customer satisfaction. When each role has access to insights, it becomes easier to identify problems, decisions are significantly informed, and tracking becomes more time-efficient.
Why do Organizations Use KPI Dashboards?
KPI dashboards deliver significant benefits, including actionable data and insights. Below is the list of advantages into which you must look.
-
Clarity in Decision Making
One can view what is happening in real time, leaving no room for guesswork. With the Key Performance Indicator dashboards, leaders will no longer have to wait for weekly reports or depend on assumptions.
-
Greater Accountability
With Dashboards, you can get access to metric ownership. Progress looks significantly easier when each KPI is tied to a specific team or role.
-
Predictive Visibility
When AI capabilities are integrated into reports, you also gain visibility into what happened and can alert users if it detects unusual patterns before they become problematic.
-
Operational Efficiency
Automated data collection eliminates manual reporting and errors. Teams can focus on strategic tasks.
-
Cross-Department Alignment
A unified dashboard gives every team the same version of the truth. This reduces conflicts, improves collaboration, and keeps everyone aligned on shared goals.
How Do You Differentiate a Good Key Performance Indicator Dashboard?
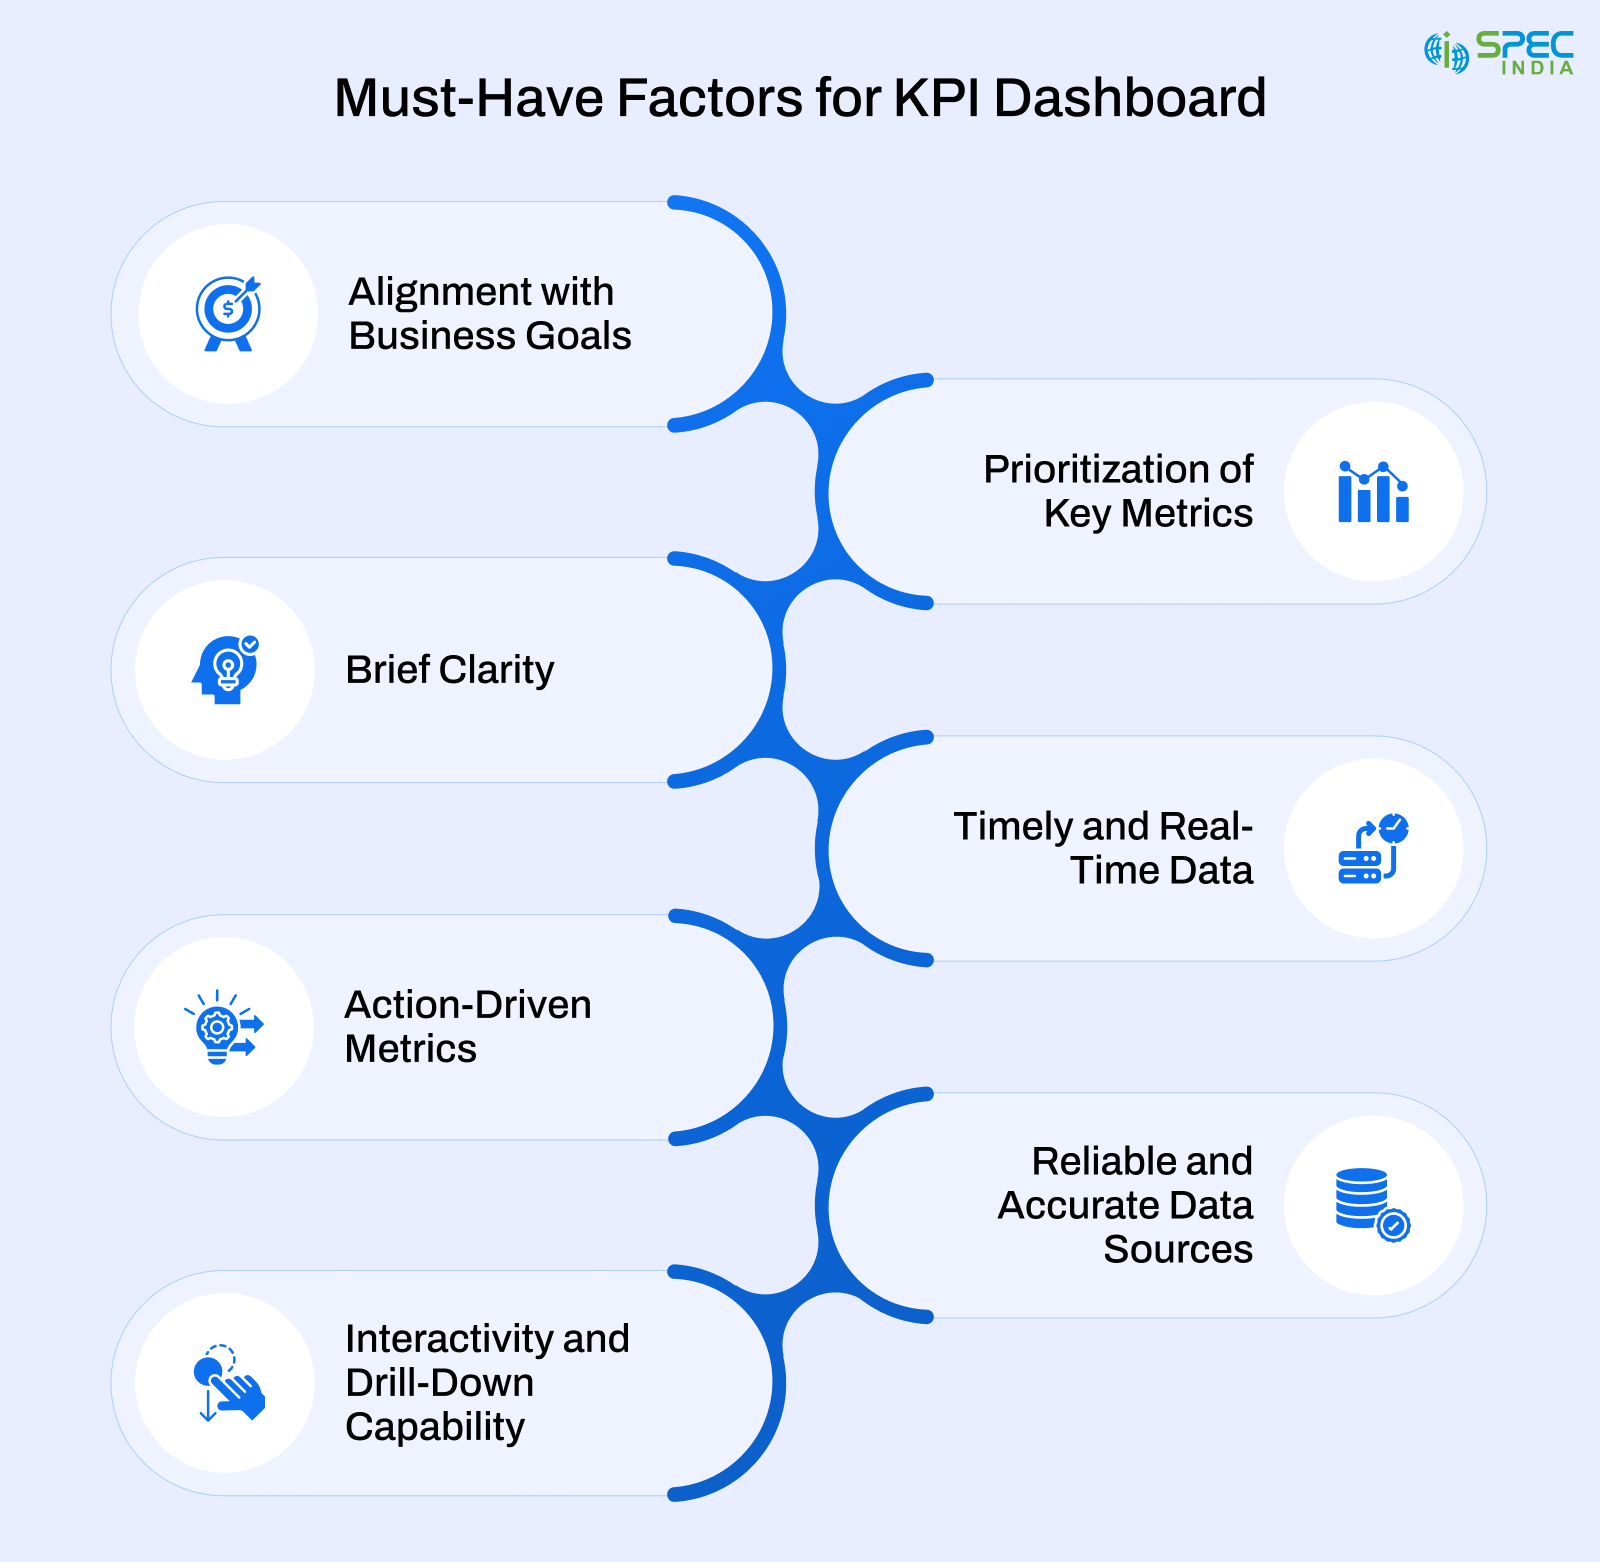
A well-defined KPI dashboard helps users better understand their business and make strategic decisions. Here are the factors that explain what a good KPI dashboard looks like:
-
Alignment with Business Goals
An ideal dashboard should include metrics that align with and support the achievement of objectives. When KPIs are directly tied to business outcomes, teams stay focused on work that truly moves the organization forward.
-
Prioritization of Key Metrics
A KPI dashboard is simpler and cleaner than you expect, since it only shows what matters to your business. It helps users better understand and efficiently access all key details.
-
Clarity Briefly
Another ideal KPI dashboard factor is its presentation, meaning the dashboard communicates with users efficiently. With clear visuals and an engaging layout, users would easily interpret the data and make informed decisions.
-
Timely and Real-Time Data
An effective dashboard automatically extracts up-to-date information, enabling users to act on it immediately. There will be no room for error, as the KPI dashboard provides accurate, up-to-date business information.
-
Action-Driven Metrics
An ideal KPI dashboard highlights issues, challenges, and opportunities, giving users a clear view of where to focus.
-
Reliable and Accurate Data Sources
KPI dashboards solely rely on accurate data. Having well-managed data visualizes facts that inform your decisions.
-
Interactivity and Drill-Down Capability
KPI dashboards with drill-down capability are necessary because they provide critical data for your business.
Now that you know the factors that make the KPI dashboard an ideal choice for any organization, it is also essential to understand how it is presented to your customers. Understanding these different types of KPI metric dashboards helps organizations choose the right one for their business.
7 Types of KPI Dashboards
Because business functions differ, views of performance will vary. KPI dashboards provide users with the right insights to make decisions with clarity and confidence.
1. Executive Dashboards
This dashboard offers a detailed overview of business health. Their focus is on strategic KPIs like revenue growth, customer retention, profitability, and market performance. It is designed for quick reviews; therefore, leaders can determine whether the organization is operating seamlessly and identify opportunities that require immediate attention.
2. Product Dashboards
A product dashboard showcases how users engage with your digital product features. It tracks feature usage, churn rates, activation rates, and user journeys. These insights help product managers understand and validate assumptions, prioritize roadmap decisions, and improve the user experience based on real-world behavior.
3. Sales Dashboards
Sales dashboards allow you to monitor pipeline health and revenue growth. Several factors include lead conversion rates, deal velocity, forecast accuracy, and win–loss ratios. With this dashboard, sales leaders can identify gaps, optimize team performance, and forecast revenue.
4. Marketing Dashboards
This dashboard lists all marketing campaigns you have prepared to promote your product. It focuses on attribution, customer acquisition cost (CAC), conversion rates, and campaign ROI. With such a dashboard, your internal teams and stakeholders get to understand which initiatives drive growth. As a result, you can prepare a budget and allocate efficiently.
5. Operational Dashboards
You will want the operational dashboards to track daily performance across processes and systems. They monitor metrics like SLA compliance, throughput, cycle time, and resource utilization. These dashboards enable teams to proactively identify inefficiencies, resolve issues quickly, and maintain consistent service quality.
6. Financial Dashboards
Another type of KPI dashboard on the list is the financial dashboard, which provides access to the organization’s financial position. It helps your monitor revenue, expenses, cash flow, profitability, and liquidity. Finance teams and management are the primary users of this dashboard, as it supports budgeting, forecasting, and financial risk management.
7. Hybrid Dashboards (AI-Enabled)
Hybrid dashboards combine descriptive insights and predictive intelligence. It has AI capabilities that enable automatic trend identification, anomaly detection, and outcome forecasting. Such dashboards would allow organizations to shift from reactive reporting to proactive decision-making.
While each KPI dashboard type serves a specific purpose, its functionality ultimately depends on how well it is designed, implemented, and maintained. Therefore, it is not sufficient to select one and start working on it. It requires defining objectives, designing intuitively, and consistent governance to offer value. Here, best practices are critical to ensuring the KPI dashboard is focused, actionable, and aligned with business requirements.
KPI Dashboard Best Practices
KPI dashboard development is straightforward, but creating one that consistently delivers results requires attention. This list of best practices is consistent, dependable, and actionable. It helps teams to understand the reporting and real performance management.
-
Define Decisions Before Metrics
You must know the decisions your dashboard should support before choosing a KPI dashboard. It enables you to focus on business decisions grounded in outcomes rather than data.
-
Prioritize What Matters Most
Start with high-impact metrics and do not focus on multiple KPIs at once, as this reduces clarity.
-
Design for a Specific Audience
You must define your audience segment to provide every user with customized access to their roles. Executives, managers, and operational teams each need various levels of detail.
-
Establish a Clear Visual Hierarchy
Always place the most important KPIs at the top and supporting metrics below. It will naturally capture the user’s attention.
-
Maintain Visual Consistency
Use standardized colors, chart types, and labels to reduce confusion and improve comprehension.
-
Always Provide Context
Moreover, you must also include benchmarks, targets, thresholds, and historical trends so users can interpret performance accurately.
-
Support Drill-Down Without Clutter
Always keep the main view clean so you can use it for deeper exploration when needed.
-
Automate Data Pipelines
With automated data pipelines, manual dependencies will decrease, allowing more time to focus on strategic tasks.
-
Enable Proactive Alerts
Make sure to notify users when metrics exceed critical thresholds or exhibit unusual or inappropriate behavior.
-
Continuously Review and Refine
Business goals change over time. Periodically reassess KPIs to ensure continued relevance and impact.
Despite following KPI dashboard best practices, developing and maintaining an effective dashboard presents a few challenges. Several factors, like data quality, misaligned metrics, and poor adoption, limit the impact of well-designed dashboards.
Common Challenges Associated with KPI and How to Avoid Them?
Despite their advantages, KPI dashboards fail to deliver value due to a few recurring challenges. It is essential to understand these issues to avoid costly mistakes.
1. Lack of Clear Objectives
Some dashboards include predefined features and irrelevant metrics, creating clutter. In such cases, KPIs lose their purpose because they lack clarity on which decisions the dashboard should support.
2. Tracking Too Many Metrics
Another major challenge is including every available metric, which can overwhelm users and reduce focus. When there is metric overload, it becomes difficult to identify what requires critical attention.
3. Poor Data Quality
When data is inaccurate, inconsistent, or outdated, it tends to erode trust. When users question the data’s reliability, they stop relying on the dashboard altogether.
4. Misalignment Across Teams
When there are multiple teams, KPIs will be misinterpreted. It leads to conflicting insights and undermines the idea of a single source of truth.
5. Overcomplicated Design
In design, challenges such as complex visuals, excessive color palettes, and dense layouts can slow the objective-oriented process. A dashboard should simplify information and not make it difficult to understand.
6. Low User Adoption
Dashboards with a steep learning curve and limited customization options often go unused. Without integration and flexibility, even well-built dashboards fail to deliver value.
7. Manual Data Updates
Manual reporting is time-consuming and error-prone. It also limits scalability and prevents dashboards from delivering real-time insights.
8. Lack of Ongoing Maintenance
Business goals evolve, but dashboards often do not. Without regular reviews and updates, KPIs become outdated and lose relevance.
Conclusion
KPI dashboards are more than reporting tools; they support stakeholder decision-making. Such dashboards are highly impactful if the goals, metrics, and the right audience are kept in mind. As a result, it brings focus, alignment, and accountability across the organization. A well-built dashboard enables the conversion of data into actionable insights that help everyone from executives to operational teams.
The objective-oriented KPI dashboard features an intuitive design, robust data foundations, and regular updates. Following best practices and choosing dashboards that align with business outcomes often deliver peak performance.
SPEC INDIA is your trusted partner for AI-driven software solutions, with proven expertise in digital transformation and innovative technology services. We deliver secure, reliable, and high-quality IT solutions to clients worldwide. As an ISO/IEC 27001:2022 certified company, we follow the highest standards for data security and quality. Our team applies proven project management methods, flexible engagement models, and modern infrastructure to deliver outstanding results. With skilled professionals and years of experience, we turn ideas into impactful solutions that drive business growth.
Table of contents
- What is a Key Performance Indicator (KPI) dashboard?
- Who Needs a Key Performance Indicator Dashboard? Use Cases
- Why do Organizations Use KPI Dashboards?
- How Do You Differentiate a Good Key Performance Indicator Dashboard?
- 7 Types of KPI Dashboards
- KPI Dashboard Best Practices
- Common Challenges Associated with KPI and How to Avoid Them?
- Conclusion
Delivering Digital Outcomes To Accelerate Growth
Let’s TalkTable of contents
- What is a Key Performance Indicator (KPI) dashboard?
- Who Needs a Key Performance Indicator Dashboard? Use Cases
- Why do Organizations Use KPI Dashboards?
- How Do You Differentiate a Good Key Performance Indicator Dashboard?
- 7 Types of KPI Dashboards
- KPI Dashboard Best Practices
- Common Challenges Associated with KPI and How to Avoid Them?
- Conclusion
Delivering Digital Outcomes To Accelerate Growth
Let’s Talk

Let’s get in touch!
India
SPEC House, Parth Complex, Near Swastik Cross Roads, Navarangpura, Ahmedabad 380009, INDIA.
-
 +91-79-26404031, 32-33-34
 -
 [email protected]
