

Streamlining Data Comparison in Power BI with Excel Integration
Data comparison is a critical aspect of data analysis and software testing. However, manually comparing Power BI reports can be a time-consuming and error-prone task.
In this blog post, we’ll explore a solution that streamlines the data comparison process by integrating Power BI with Excel. This approach not only saves time but also enhances accuracy and efficiency in your data analysis.
Problem Statement: Manual Data Comparison
Traditionally, checking for differences in data between two Power BI reports involves the tedious process of downloading both reports and manually comparing them. This method is not only time-consuming but also prone to human error.
For those who need to check for differences frequently, this process can become a real headache. Moreover, it’s not conducive to collaborative work or sharing insights with clients.
Solution: Excel Integration with Power BI
- As part of the solution, we will be discussing the seamless integration of Power BI reports with Excel, which not only streamlines data comparison but also addresses key challenges associated with Big Data.
- This approach enables efficient data comparison, empowers clients to access dynamic reports, enhances data security, and ultimately transforms your data analysis workflows.
Interesting Read: Power BI vs Excel Comparison
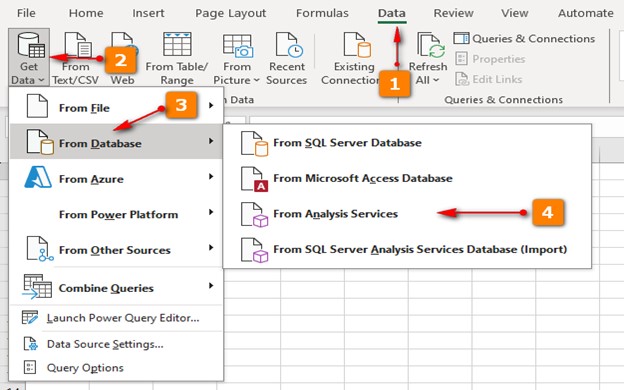
Step 1. Automating Data Extraction:
The first step to streamline data comparison is to automate data extraction from Power BI reports. Excel allows you to do this seamlessly by connecting to Power BI models using the “Get Data” feature and selecting Analysis Services. This integration lets you fetch data in Excel just as you would in Power BI. Also, it not only simplifies the process but also speeds it up, which is crucial when dealing with large data volumes.
Step 2. Creating a Comparison Sheet:
Once you have your data in Excel, the next step is to set up a comparison sheet. This sheet serves as the foundation for comparing data between two Power BI reports. Organize the data in a way that facilitates easy comparison, such as arranging it in tables or pivot tables.
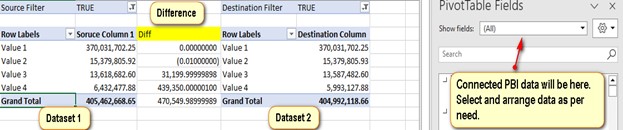
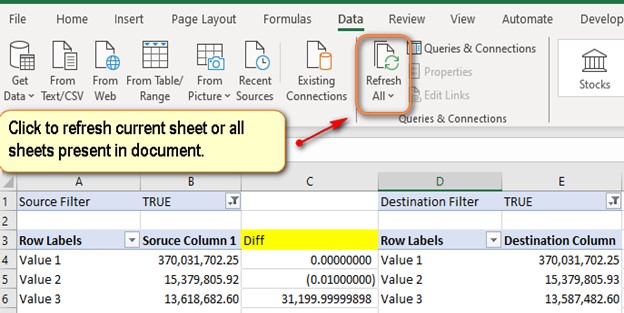
Step 3. Data Comparison Made Easy:
With your comparison sheet in place, you’re ready to start comparing data effortlessly. Whenever you need to check for differences, simply refresh the data in your Excel sheet. Excel will retrieve the latest data from your Power BI models, allowing you to see any discrepancies between the reports in real-time.
Benefits of Excel-Power BI Integration
The advantages of integrating Power BI with Excel for data comparison are manifold.
- First and foremost, it saves your valuable time that would otherwise be spent on manual comparisons.
- Additionally, the automated approach enhances accuracy, as there’s no room for human error in the data retrieval process.
- This streamlined workflow enables faster decision-making and more efficient data analysis.
- One remarkable benefit of this approach is the ability to share dynamic Excel reports with clients or colleagues. You can grant access to the comparison sheet, allowing them to check data discrepancies and insights even in your absence. This collaboration fosters better decision-making and client satisfaction.
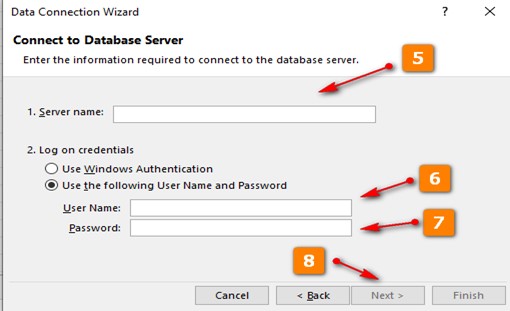
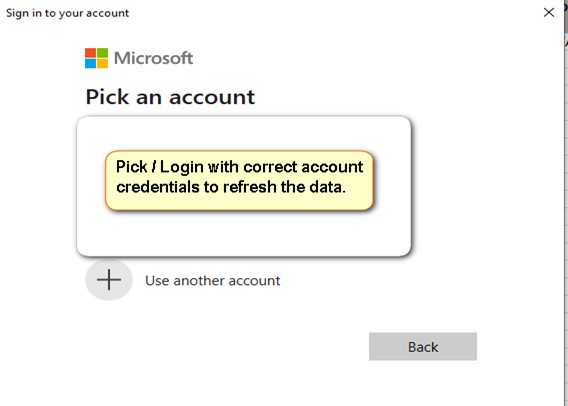
Enhanced Data Security:
In addition to streamlining data comparison and sharing, Excel-Power BI integration offers enhanced data security. When connecting to Power BI, Excel will prompt for credentials, ensuring that only authorized individuals can access sensitive data. This adds an extra layer of protection, crucial in maintaining data integrity.
Handling Large Data Volumes:
While this integration is a game-changer for data comparison, it’s important to note that dealing with Big Data can result in large data volumes. As a result, refreshing your data may take some time, typically around 5-6 minutes or more. This is a trade-off for the benefits of automated and accurate data comparison.
Use Case Example:
To illustrate the power of this integration, consider a real-world scenario. Imagine you’re responsible for quality assurance testing in a Big Data project. Your team needs to compare monthly sales reports from two different regions regularly.
By integrating Power BI with Excel, you not only save time and enhance accuracy but also share dynamic reports securely with your client. You can effortlessly compare sales data, identify discrepancies, and make data-driven decisions without the hassle of manual comparisons. The occasional longer refresh time becomes a small price to pay for the advantages gained.
Conclusion:
In conclusion, the integration of Power BI with Excel offers a practical solution to the age-old problem of manual data comparison. It not only simplifies the process but also enhances the accuracy and efficiency of your data analysis tasks. If you’re tired of spending hours on manual comparisons, it’s time to explore this automation approach and streamline your data comparison processes.
Unlock the potential of Excel integration with Power BI and transform your data analysis workflows. It’s not just about saving time; it’s about making your data work smarter for you.
SPEC INDIA is your trusted partner for AI-driven software solutions, with proven expertise in digital transformation and innovative technology services. We deliver secure, reliable, and high-quality IT solutions to clients worldwide. As an ISO/IEC 27001:2022 certified company, we follow the highest standards for data security and quality. Our team applies proven project management methods, flexible engagement models, and modern infrastructure to deliver outstanding results. With skilled professionals and years of experience, we turn ideas into impactful solutions that drive business growth.
Table of contents
Delivering Digital Outcomes To Accelerate Growth
Let’s TalkTable of contents
Delivering Digital Outcomes To Accelerate Growth
Let’s Talk

Let’s get in touch!
India
SPEC House, Parth Complex, Near Swastik Cross Roads, Navarangpura, Ahmedabad 380009, INDIA.
-
 +91-79-26404031, 32-33-34
 -
 [email protected]
