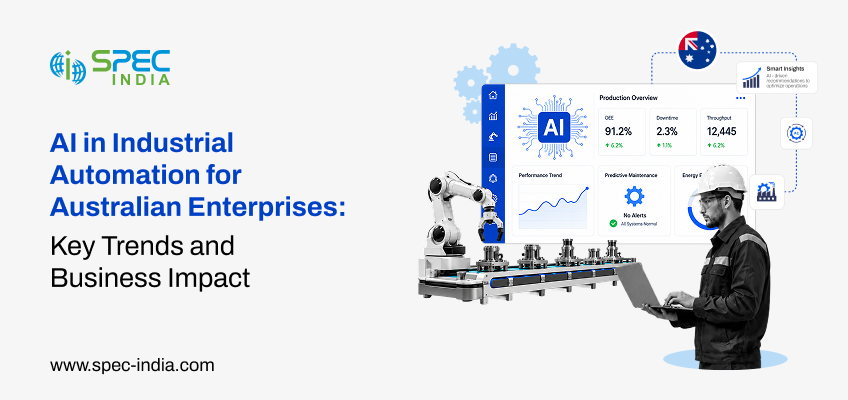
Loading...

Power BI vs. Excel Comparison. It’s Time To Shift Your Reporting

Author
SPEC INDIA
Posted

March 27, 2020

Updated

June 13th, 2023

PowerBI-vs-ExcelForget gigabytes, data is being generated in zettabytes nowadays.

According to the research by the IDC group, the size of the data we generate annually will reach 44 zettabytes (44 trillion gigabytes). The importance of data analysis has increased dramatically over the past few years but there is still a vast amount of data is ignored or not analyzed. Data is everywhere. Companies are embracing data analytics and data intelligence capabilities to uncover hidden insights that can help companies make data-driven decisions.

To date, Microsoft Excel has been preferred data management and visualization tool. It is one of the widely-used and popular spreadsheet applications in the business world. With data playing a vital role to remodel businesses from scratch, new tools and technologies are introduced day-by-day to reap the benefits of big data.

Power BI, a popular self-service data visualization tool from Microsoft, has made it easy for businesses to extract intelligence from various data sources with ease. It offers business analytics and intelligence services that are interactive, easy-to-use, and secure.

Good Read: Power BI In 10 Minutes– What, Why, Who, How Justified

It is quite obvious to consider that Power BI is equipped with modern data intelligence features and delivers better insights than Excel.

Let’s compare the traditional reporting tool and modern Power BI in detail.

This post explains key reasons behind Power BI’s suitability over Excel for reporting and why we advocate Power BI consulting for better, forward-looking results using data.

Power BI vs Microsoft Excel

Collect And Access Data: Flexibility? Accessibility? Or Both? Who Is Better?

Due to ubiquitous nature and increasing volume, data is available in multiple formats. Excel offers support for limited data sources and it is mainly used for analysis and computations on data with a wide range of functions and mathematical operations on data.

Excel 2013 provides a wide range of Power BI features and functionalities to turn data into meaningful information. This includes support for external data sources such as SQL tables, cubes, Microsoft Azure Data, and more.

ExcelDataSources

When it comes to Power BI, you can select any type of data you want including data from any app or services, reports, cloud-based sources, workbooks, CSV files, Excel, or databases. It also has a powerful compression algorithm that makes larger data files easily accessible, analyzed, and stored. Companies with consistent and larger data flow are using Power BI to get a 360-degree view of products/services they’re offering. It offers a comprehensive set of data connectors.

SPEC INDIA BI

Excel, on the other side, makes it difficult to work on larger datasets. It will be difficult to add more sales data or datasets to the current one, taking more time and effort to get an overall scenario.

Whenever new data is discovered, it can be integrated with Power BI without linking or reopening everything. This flexibility of adding and linking datasets reduces overhead as the software will automatically perform data refreshes (you can also schedule data refresh) and remember data patterns

Reporting And Dashboarding: Is Power BI A Winner?

Power BI makes data analysis and reporting a breeze with its powerful features. Power BI reports are visually attractive, easy-to-understand, and offer multi-perspective insights that can help make decisions faster. Reports are highly interactive and dynamic – data changes, the value in the report changes. Reports can have a single visual or more than one visual. Resizing, editing, easy formatting, natural language querying, and filtering make Power BI one of the ideal tools for data reporting.

On the other side, Excel has a tabular data format and also allows displaying data in various chart formats. But, with the larger datasets, it lacks clarity and flexibility. It is more suitable for simple and structured data models and has limited scope for datasets and reports.

Visualization: Transform Data Into Insights, Rapidly

This is where the Power BI ranks higher than any other visualization tool. With self-service analysis capacity, various data visualizations, cloud-based services, and security measures, Power BI succeeded to gain a leading position among other tools in the market.

Why Power BI For Better Visualization?

  • Easily Identify Trends From Every Point Of View:

No matter what size is, you can analyze a vast amount of data with clarity and ease. You can try various experiments and attributes to get precise results. Analyzing data from various dimensions at different times and with a range of factors help an analyst to predict faster and get into a broader picture of data.

Trend-Analysis-in-Power-BI-4
Image Source: visualbi.com
  • Personalized Dashboards:

Power BI Dashboards are called a canvas where all the reports are highlighted with snippets. These visualizations are coming from reports and reports are based on datasets or collection of different datasets. You can click any visualization to view the complete report. These personalized dashboards act as a 360-degree view of reports, activities, and datasets. With this, you can keep an eye on all the activities, visuals, and underlying data sources with attractive themes, interactive tiles, and visually appealing layouts. Users can customize dashboards or edit those as per their needs.


4645.dashboard2
Image Source: Microsoft 
Checkout our Live and Customized Power BI Dashboards.

Live Power BI Dashboards SPEC INDIA Portfolio

  • Alerts:

Power BI helps analysts to set alerts based on KPIs (Key Performance Indicators). These alerts can notify you when any change in a dashboard or value exceeds the limits you set.

Here’s the step-by-step video from Power BI community to help you set alerts.

  • A Wide Range of Charts:

With built-in, self-service, and AI-driven Business Intelligence Solutions, Power BI’s powerful algorithms help convert data into smart insights. It offers various charts like:

  • Bar and column charts
  • Line charts
  • Pie charts
  • Tables
  • Area charts
  • Doughnut charts
  • Gauge charts
  • Funnel charts
  • Scatter charts
  • Multi-row cards
  • Single number cards
  • Maps
  • Tree maps
  • Combination charts
PowerBICharts
Image Source: Microsoft

Templates and Themes: User Experience Is A Key

You can create or customize themes and templates to get consistent, appealing, and uniform user experience across the visuals and analysis. Drag-and-drop functionality, easy editing and removing, smoother navigation, and user-centric design together create a captivating experience for users as well as for designers.

image_2020_03_19T07_28_49_836ZMake Working Together Easier

Businesses are operating in the time of faster collaboration and rapid changes. Power BI makes sharing easier like never before. Dashboards or reports can be shared with other members of the organization at just a few clicks. Power BI service offerings are available for on-premises or in the cloud, ranging from small businesses to enterprise-scale intelligence.

ExcelChartsExcel also offers visualization options such as tables, line charts, bar charts, pie charts, column charts, and so on. Being a traditional spreadsheet program, it has limited scopes for integration, collaboration, functions, and formats. Although, with a rich set of mathematical formulas and pivot tables, organizing complex data structures and setting KPIs are easy with Excel (advanced versions).

Data Security Is A Mission-Critical Priority

Regardless of tools and technology, you are using, data security has made everyone think in that direction with a strategic roadmap and preventive measurements. Power BI has built-in security controls including role-based authentication, row-level security feature, networking security, risk mitigation, session monitoring, authorization, and cloud-based security provisions.

powerbi-desktop-security-create-rule
Image Source: docs.microsoft.com

In Excel, you can restrict access for a particular file, worksheet, or even workbook. You can also lock files to hide visibility or grant read-only access to prevent modification or editing.

Mobile Is A Way Forward:

Power BI offers several apps for Android, iOS, and Windows 10 mobile platforms. All the reports and dashboards, regardless of their locations (on-premises or cloud) are available in the mobile apps. It allows viewing and interacting with them and also offers some management controls for enterprises via mobile apps.

Moreover, Power BI’s custom visualization and effortless integration with other apps are added advantages.

PowerBI-MobileApp
Image Source: Google Play
Power BI or Excel: Time To Shift Data Reporting To Power BI From Excel

Data has huge potential to help organizations make decisions that shape a better future of companies of any size, any type. With self-service abilities, Power BI has changed the way how organizations are considering data and its benefits. Empowering people to make data-driven decisions easily without needing to study data science and analytics deeply, Power BI has proven its potential. Microsoft is continuously making efforts to make Power BI a feature-rich, secure, and powerful BI tool with support from a large community of analysts, BI professionals, data scientists, and data engineers.

“An organization’s ability to learn, and translate that learning into action rapidly, is the ultimate competitive advantage.” – Jack Welch, Chairman & CEO, General Electric

Taking deep dive into data for better actionable insights seems like a necessity rather than an advantage. Have you upgraded your reporting to Power BI?

Delivering Digital Outcomes To Accelerate Growth
Let’s Talk
Author
SPEC INDIA

SPEC INDIA, as your single stop IT partner has been successfully implementing a bouquet of diverse solutions and services all over the globe, proving its mettle as an ISO 9001:2015 certified IT solutions organization. With efficient project management practices, international standards to comply, flexible engagement models and superior infrastructure, SPEC INDIA is a customer’s delight. Our skilled technical resources are apt at putting thoughts in a perspective by offering value-added reads for all.

Delivering Digital Outcomes To Accelerate Growth
Let’s Talk