| Feature | Tableau | Power BI |
|---|---|---|
| Ease of Use | User-friendly with a drag-and-drop interface, but requires some expertise for advanced use. | It is simple for beginners, especially for Microsoft Office users, thanks to Power BI’s user interface, which is designed for simplicity. |
| Data Visualization | Creates stunning and highly customizable visuals ideal for data storytelling. | It provides compelling visuals but is less polished than Tableau’s designs. |
| Data Connectivity | Connects to a wide range of data sources, including big data platforms. | Works well with Microsoft tools but may struggle with massive datasets. |
| Performance with Large Data | Handles large datasets efficiently with in-memory processing and live connections. | Performs well but relies heavily on Azure for scaling. |
| Integration with Other Tools | Broad third-party tool integration, including Google Analytics and Salesforce. | Seamlessly integrates with Microsoft ecosystem tools like Excel and Azure. |
| Pricing | It starts at $15/user/month but can get expensive for larger teams. | Starts at $9.99/user/month, making it more affordable. |
| Community and Support | A strong community of data visualization experts. Excellent resources. | Large community and easy access to Microsoft’s extensive support. |
| AI and Machine Learning Features | It integrates with Python and R, offering advanced statistical and predictive analytics. | Includes AI-driven insights and Azure ML integration. Great for business users. |
| Deployment Options | Flexible with cloud and on-premises deployment. | Primarily cloud-based, with an on-premises option via Power BI Report Server. |
| Ideal Use Cases | Advanced data visualization, large datasets, and data storytelling. | Cost-effective, quick insights, and integration with Microsoft tools. |


Loading...
Tableau vs Power BI: Which Tool Should You Choose for Data Visualization?
When it comes to understanding data, it all comes down to selecting the appropriate tool. Tableau and Power BI are widely applied business intelligence tools that analyze and visualize data in accessible formats. Tableau pulse has an outstanding ability in data. Power BI is preferred when you are using other Microsoft products.
Yet, with each having its advantages, how can the right decision be made for the specific business? At best, we offer data visualization services. Our work speaks louder than words; have a look at our portfolio.
This blog will discuss the differences between Power BI and Tableau. Both tools offer the same features, and we will also assist you in selecting the best tool for your business. Let’s start by understanding the basic concepts of Tableau and Power BI and their specialties.
Overview of Tableau and Power BI
Tableau
Tableau is one of the most recognized business intelligence tools. Tableau Desktop is the primary application for creating visualizations and dashboards, allowing users to design and build interactive reports.
It offers a user-friendly interface, making it accessible to a wide range of users. Tableau offers simple and effective interaction, as well as enhanced capabilities for creating complex infographics. Its robust visualization capabilities enable extensive customization and advanced visual features, supporting detailed and dynamic data analysis. It allows you to query various data sources and is ideal for those who need to use their tools to create engaging, visually appealing dashboards. Tableau supports self-service analytics, enabling non-technical users to explore and analyze data independently. Its primary advantage is mapping large volumes of fragmented data into comprehensible, visually appealing, and easily navigable graphical interfaces, which is why many data professionals, data scientists, and analysts prefer it. While Tableau is easy to use, it does have a slightly steeper learning curve compared to some other tools, making it especially suitable for seasoned users.
Power BI
Microsoft Power BI is fully integrated with other Microsoft solutions, such as Excel and Office 365. Power BI Desktop is the primary application for building reports and dashboards, offering three primary views (report, data, and model) on the left side of the canvas for ease of use. It is suitable for all users because it is relatively easy to use, although the company has demonstrated that it offers powerful analysis tools and robust business intelligence capabilities. While Power BI does not have the advanced visual capabilities of Tableau, it is crucial for Tableau that Power BI is affordable, easy to use, and therefore plentiful for creating an environment where every business user can analyze data. Power BI’s integration with Microsoft tools and its analytical features make it a strong choice for organizations seeking seamless data workflows.
Looking for expert assistance? A Power BI consultant can help you leverage the full potential of Power BI for your business.
Check out how Tableau Pulse can make data work for you through AI.
What are the Features of Tableau and Power BI?
Now, let’s discuss the features of Tableau and Power BI individually. Both Tableau and Power BI are leading data visualization tools that enable users to transform raw data into interactive dashboards and insightful reports. These platforms allow users to explore data interactively, making it easier to analyze complex information and uncover patterns.
Data exploration is a key capability of both tools, providing users with advanced options for in-depth analysis, data shaping, and comprehensive reporting. This will help you understand which is more appropriate for your workplace.
Tableau Features
Tableau can be explained as a wizard that helps you interpret your data. Taking numbers and data and transforming them into meaningful, easy-to-comprehend graphics is done effectively. Tableau offers a wide range of features and flexibility, making it suitable for various data visualization and analytics needs. Here are the Tableau features that make it stand out:
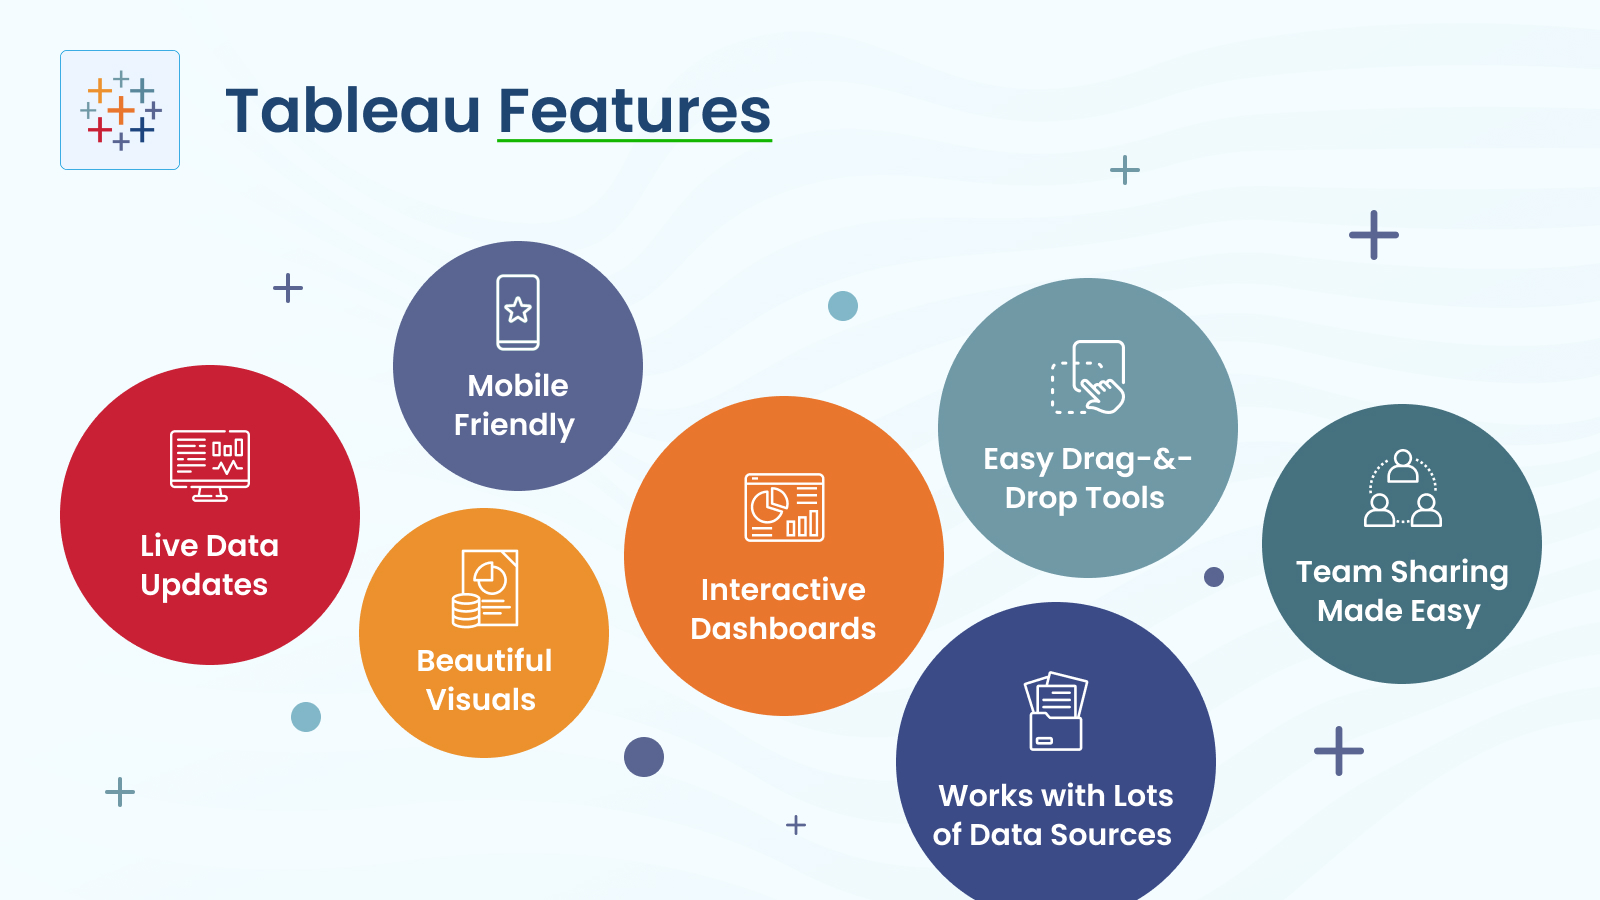
- Easy Drag-and-Drop Tools
It’s as simple as that. You build your data and drop it onto Tableau, automatically transforming it into charts, graphs, or maps. - Beautiful Visuals
Tableau offers a range of compelling data presentation options, including simple bar graphs and heat maps, as well as more complex charts such as pie charts and line charts. Using lists can also ensure that your reports appear professional, easy to read, and fiercely businesslike. Tableau can visualize large datasets, making it ideal for detailed and comprehensive analysis. - Live Data Updates
Would you like to review your current sales? Tableau does not create a copy of data; it extracts it from live data sources and always provides the most recent data. - Works with Lots of Data Sources
Tableau is compatible with almost all data sources, including Excel files, databases, cloud services, big data platforms, and more. Its ease of use allows you to connect to multiple data sources, enabling you to blend and analyze data from various origins. - Interactive Dashboards
Tableau dashboards enable you to interact with data by clicking on various elements to explore their contents. For example, clicking can show sales in a particular pie chart area. - Mobile-Friendly
If you’re at work, in a meeting, or on the go—whether on the bus, subway, or in the back of a taxi— Tableau works seamlessly on your phone or tablet, so your data is always with you. - Team Sharing Made Easy
It allows you to share your Tableau dashboards with your team, keeping everyone informed and up to date. For collaboration and secure sharing, Tableau Cloud and Tableau Server provide deployment options for sharing dashboards and visualizations at scale, whether on-premises or in the cloud. - Performance and Scalability
Tableau is capable of handling bulk data efficiently, ensuring high performance even with enterprise-sized datasets and millions of data points. - Advanced Analytics Features
Tableau includes advanced analytics features that support deeper data analysis and more sophisticated insights for informed decision-making.
Ultimately, the Tableau Software Development Kit (SDK) empowers developers to create custom integrations and advanced visualizations using programming languages such as C, C++, Java, and Python, thereby further extending Tableau’s capabilities.

Features of Power BI
Power BI, by Microsoft, is your digital assistant for business intelligence. The best technology is the one that facilitates the simplification of intricate data into fundamental insights to be acted upon. Let’s see what makes it unique:
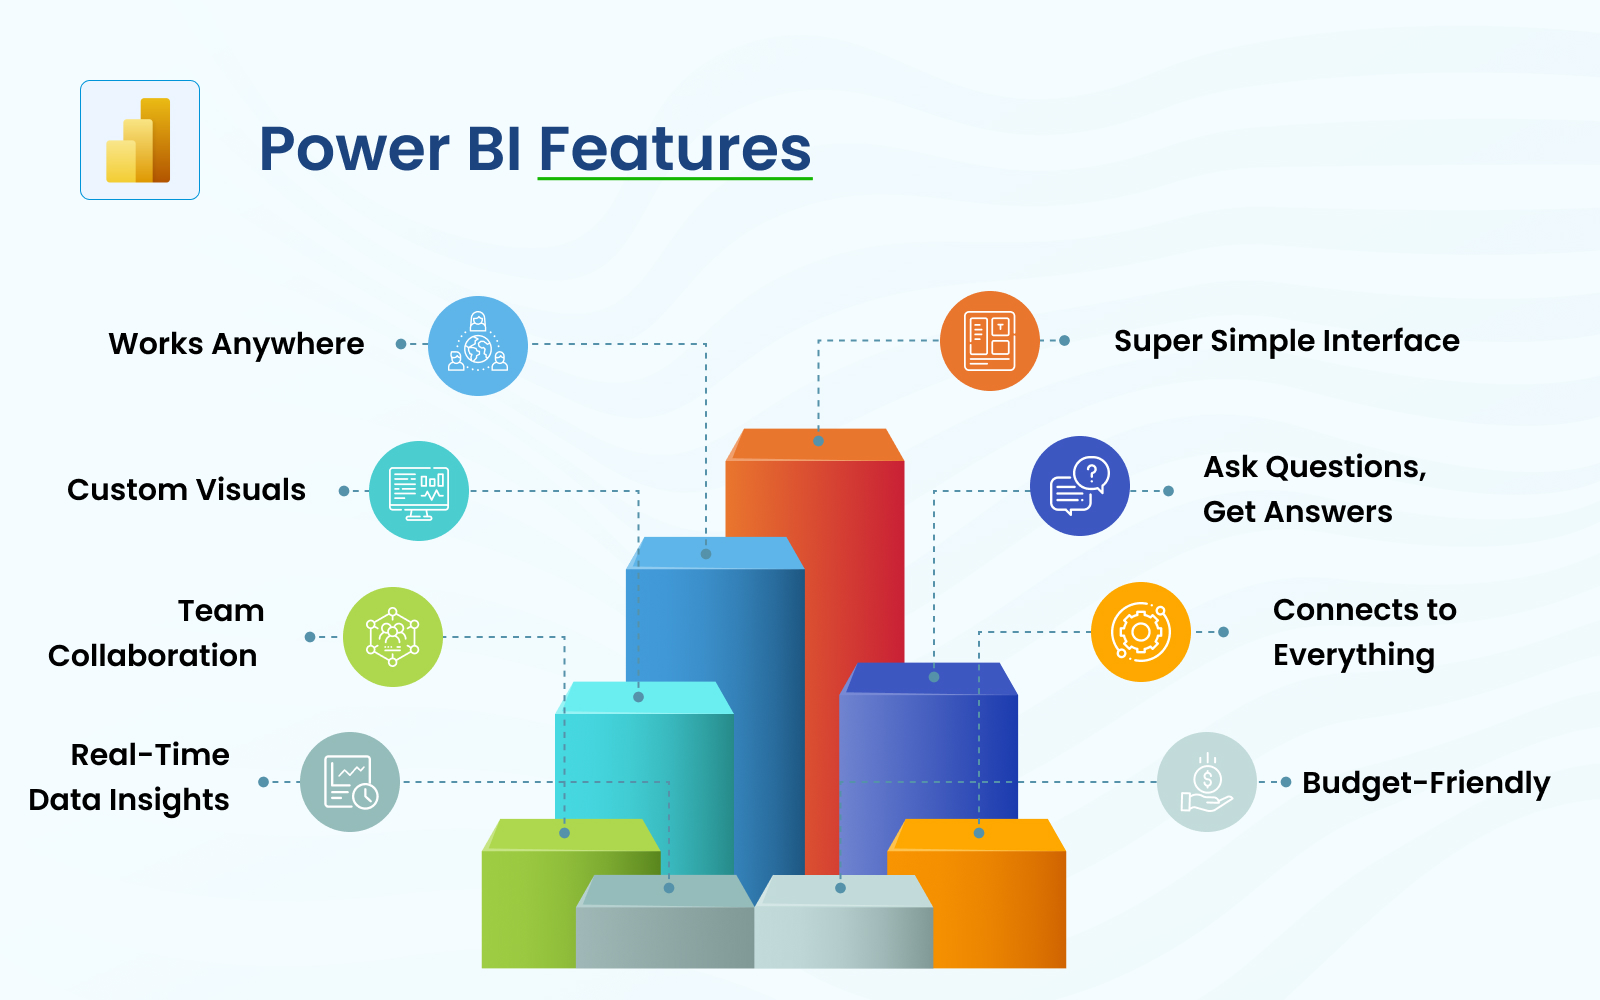
- Super Simple Interface
If you have worked with Microsoft Excel or Word, you can easily navigate Power BI. It must be simple and easy for someone without prior interaction with data tools, making it accessible even for non-technical users who may not have a background in analytics. - Connects to Everything
Power BI can connect to any data source, including spreadsheets, databases, cloud services, and solutions like Excel and SharePoint. It is important to consider how Power BI integrates with your existing tech stack to ensure seamless data flow and compatibility. - Custom Visuals
Power BI provides a visual you can insert into the report in addition to the basic chart and graph. You can add more presentations at the bottom to make the data more attractive. - Ask Questions, Get Answers
Are you looking for something and have no idea where to start? Just ask! Power BI has several AI features, such as natural language queries—ask, ‘What were the sales last month?’ and the software will answer. - Real-Time Data Insights
Power BI features an automatic update that allows you to monitor performance as it occurs. With data refreshes, frequent data refreshes, and more frequent data refreshes available—especially in higher-tier plans like Power BI Premium—you are always the first to know what is happening. - Advanced Analytics
Power BI supports powerful data manipulation and data analysis expression (DAX) capabilities, enabling users to transform, model, and analyze data for deeper insights. - Works Anywhere
On your laptop, phone, or tablet, Power BI keeps your data accessible wherever you are. - Team Collaboration and Licensing Options
Power BI facilitates teamwork. You can share reports with your colleagues through Microsoft Teams or email, keeping everyone on the same page. Licensing options include Power BI Pro for team-based collaboration, Power BI Premium for enterprise-level deployment with dedicated resources and more frequent data refreshes, and Power BI Embedded for integrating analytics directly into your own applications. - Budget-Friendly
Power BI is an affordable solution that offers excellent value, particularly for businesses already utilizing other Microsoft products.
Tableau and Power BI are both incredible tools, with distinct capabilities. The differences between Power BI and Tableau are not substantial, but both are effective in their own right. Tableau is well-suited if eye candy is your priority, and Power BI is a good option if you’re heavily invested in the Microsoft ecosystem or looking to save your budget.
If you have a large amount of data, it is recommended that you utilize Power BI Consulting Services. Once you understand, you can also explain it to your team. Learning Power BI can significantly boost your career development by equipping you with in-demand data analytics skills.
Advantages and Disadvantages of Tableau vs Power BI
We have two widely used data visualization tools: Tableau and Power BI. Each business intelligence tool has its advantages and disadvantages, so the optimal option will depend solely on the business activity’s requirements.
Power BI advantages include seamless integration with the Microsoft ecosystem, extensive visualization options, and robust sharing and collaboration capabilities, making it easy for users to create and share dynamic dashboards and reports. Tableau’s advantages are its flexibility for visualizations, strong data source connectivity, and granular control over content access, which make it a powerful tool for technical users.
However, Power BI disadvantages include complexity for non-technical users, potential performance issues with large datasets, and high scalability costs, which can limit its effectiveness despite its popularity.
Tableau: Powerful Visuals for Complex Data
Advantages of Tableau
- Great for Visualization: Tableau is renowned for creating visually appealing and compelling charts and dashboards. However, if you need your data to be presented and tell a story in a literal sense, then custom dashboard development with Tableau would be an ideal choice. Although it is a highly effective tool for creating eye-popping graphics with vibrant features to aid business analysis, Tableau is relatively easy to use.
- Handles Large Data Well: Tableau works effectively with large datasets and does not compromise system performance. Your company may operate on millions and billions of records, and Tableau can handle them more efficiently than other tools.
- Advanced Features: Tableau’s features are extensive, making it simple to work with complex data. It provides tools that help you analyze and visualize data easily, making it easier to turn raw information into valuable insights. Tableau also enables users to work directly with the underlying data, allowing for deeper analysis and more customized insights.
- Interactive Dashboards: Tableau enables users to directly engage with their data and analyze it at various levels and from multiple perspectives. This is particularly useful when a team requires a detailed examination of data.
Are you looking for data visualization services to make your data work for you? Tableau makes your data not just understandable but impactful.
Disadvantages of Tableau
- Expensive: Tableau has its drawbacks, one of which is its cost. For a company, for example, Tableau’s price starts at $100 per user per month. The features are sliding, where you can add more users or opt for advanced features; thus, it may be costly for organizations with a small number of employees.
- It Takes Time to Learn: One potential problem users may encounter when using Tableau is the relative richness of its options and opportunities. Tableau has a steeper learning curve compared to some other tools, so it may take a specific period before new users become accustomed to the tool while researching.
- Not Great for Data Preparation: Tableau was not designed for data preparation, handling, or cleaning, but rather for data analysis. That is why you may have to utilize other tools to preprocess your data before loading it into Tableau.
Power BI: Budget-Friendly with Easy Integration
Advantages of Power BI
- Affordable: Power BI is more cost-effective than Tableau. It is a good option if you don’t want to spend much and need dependable software. Thanks to its affordability, Microsoft’s Power BI is growing rapidly and is used by over 200,000 businesses globally.
- Works Well with Microsoft Tools: Power BI and Microsoft products, such as Excel or Office 365, integrate seamlessly. Power BI is easier if your business already employs some of these. If you already use Excel for data analysis, Power BI’s seamless integration with Excel will make it easy to get started. Power BI can also integrate with data models from other platforms, making it easier to connect and utilize existing business intelligence assets.
- User-Friendly: It is an intuitive tool that does not require the help of an IT specialist or previous programming experience. Developing reports and dashboards can be straightforward, even without programming skills.
- Great for Reporting: Power BI is one of the best business intelligence tools. It enables users to create “pretty” reports that are easily navigable and, more importantly, shareable with other stakeholders. It’s perfect for any team that needs to share some insight quickly.
- Advanced Analytics Integration: Power BI supports integration with the R programming language for advanced analytics and custom visualizations. For enterprise users, Microsoft Revolution Analytics is available, providing enhanced capabilities for data analysis and modeling.
Disadvantages of Power BI
- Limited Features for Advanced Users: Tableau appears to have more functionality embedded than Power BI. Depending on the business’s specific needs for data analysis and visualization, Power BI may not suffice, especially since Tableau offers broader support for the R programming language and other programming languages.
- Can struggle with large datasets: It is efficient when used on small datasets, but becomes less responsive when dealing with significant amounts of data.
- Limited Customization: Tableau offers more customization options than Power BI, which provides only foundational visualizations. Although Power BI will enable you to generate and create unique report visuals, few built-in report visuals offer complete customization.
Choosing the Right Tool for Your Needs
When choosing between Tableau and Power BI, it depends on your specific business needs and how well each tool aligns with your existing tech stack. Below is a breakdown of the tools and guidance on how to determine which one fits your needs best.
Choose Tableau if
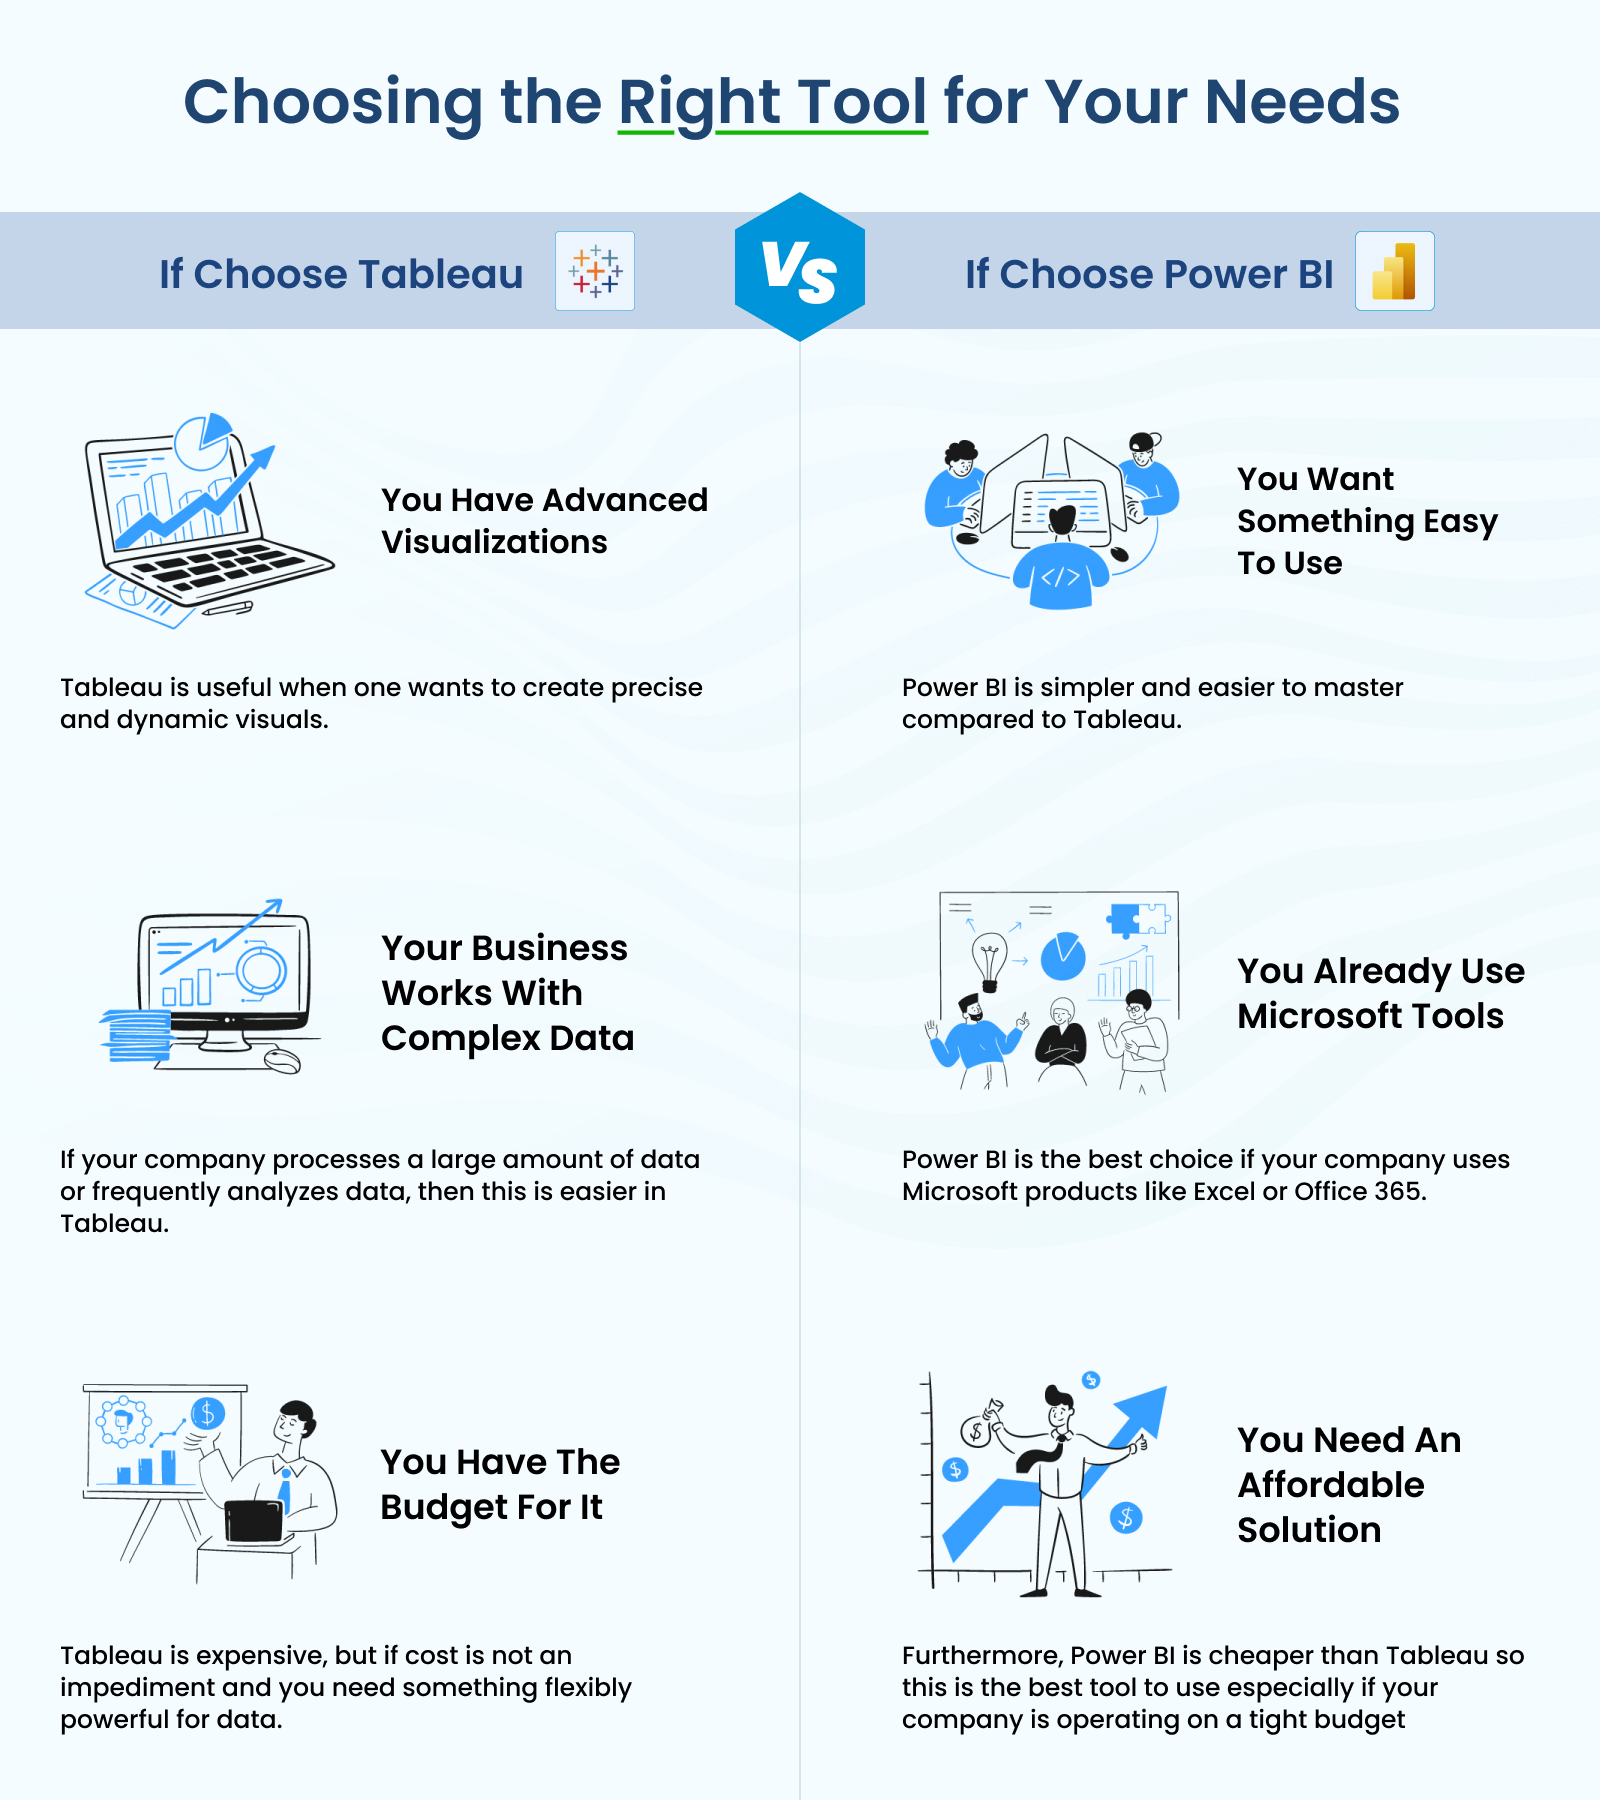
- You want advanced visualizations: Tableau helps create precise and dynamic visuals. It is best for any company that wants to represent data clearly and brightly.
- Your business works with complex data: If your company processes or frequently analyzes a large amount of data, Tableau makes this easier. This tab is designed for data analysis and will help you make better sense of the data provided.
- You have the budget for it. Tableau is expensive, but it can be valuable if cost is not an impediment and you need something flexible and powerful for data handling and visualization.
- You require strong self-service analytics: Tableau offers robust self-service analytics features, enabling non-technical users to explore and analyze data independently.
You can consider Tableau consulting services if you believe that Tableau will meet your needs effectively.
Choose Power BI if
- If your company already uses Microsoft tools, Power BI is the best choice. It can easily integrate with Microsoft products, such as Excel or Office 365, making it convenient to combine all your data and ensuring compatibility with your existing tech stack.
- You need an affordable solution. Furthermore, Power BI is more cost-effective than Tableau, making it the best tool to use primarily if your company operates on a tight budget. It is recommended for companies seeking attractive value at a reasonable cost.
- You want something easy to use: Power BI is not as complex and, therefore, not as difficult to master as Tableau. In cases where you need a tool that your team can start using immediately and with little or no further training, Power BI is suitable.
- You value self-service analytics: Power BI provides intuitive self-service analytics, allowing users across your organization to access and analyze data without heavy IT involvement.
What is More Popular, Power BI or Tableau?
Power BI is more popular than Tableau, particularly within organizations that might require a less expensive but equally efficient tool.
1. Power BI’s Growing Popularity: Power BI is quite popular now, and the reasons are apparent: first, it is pretty cheap; second, it integrates with other Microsoft tools such as Office 365 and Excel. This makes it a favorite tool, particularly among small to medium-sized companies. It has over 200,000 users worldwide and is experiencing rapid growth. There is also a growing interest in learning Power BI, as many data professionals view it as a valuable skill for career advancement and expanding job opportunities.
2. Tableau’s Popularity: Tableau is also quite popular; however, it is preferred by the business audience and is especially favored by data professionals who require more elaborate data visualization tools. Large-scale companies and data specialists value business intelligence tools since they allow the generation of sophisticated and dynamic reports. However, compared to Power BI, Tableau has higher recognition, but unfortunately, it is not as widely used as it could be. Opt for Tableau consulting services today to better understand how this tool can help you.
3. Why Power BI is More Popular: Power BI is more popular because it is easy, cheap, and compatible with the tools that businesses use from Microsoft. Secondly, one of the unique features of Power BI is that users don’t need to purchase it, as it offers a free version that businesses can try before making a purchase.
This tool provides seamless integration and robust reporting capabilities for businesses seeking Power BI real-time reporting services, enabling them to make data-driven decisions quickly.

Final Thoughts
While both are great data visualization tools, they can target different audiences and handle other business problems. The latest figures indicate that Tableau excels primarily in data analytics and visualization, instantly giving it a competitive advantage in the data science community.
On the other hand, Power BI’s affordability, ease of use, and integration with the Microsoft ecosystem make it an excellent choice for businesses of all sizes. Ultimately, the choice between Tableau and Power BI comes down to your organization’s requirements, budget, and existing tools. Carefully assess your needs, and you’ll be well on your way to leveraging the full potential of data visualization. We offer robust bi-consulting services and have expertise in working with Tableau. Feel free to reach out to us at any time by completing the form. Our team will get back to you within 24 hours.
SPEC INDIA is your trusted partner for AI-driven software solutions, with proven expertise in digital transformation and innovative technology services. We deliver secure, reliable, and high-quality IT solutions to clients worldwide. As an ISO/IEC 27001:2022 certified company, we follow the highest standards for data security and quality. Our team applies proven project management methods, flexible engagement models, and modern infrastructure to deliver outstanding results. With skilled professionals and years of experience, we turn ideas into impactful solutions that drive business growth.
Table of contents
Delivering Digital Outcomes To Accelerate Growth
Let’s TalkTable of contents
Delivering Digital Outcomes To Accelerate Growth
Let’s Talk

Let’s get in touch!
India
SPEC House, Parth Complex, Near Swastik Cross Roads, Navarangpura, Ahmedabad 380009, INDIA.
-
 +91-79-26404031, 32-33-34
 -
 [email protected]
