

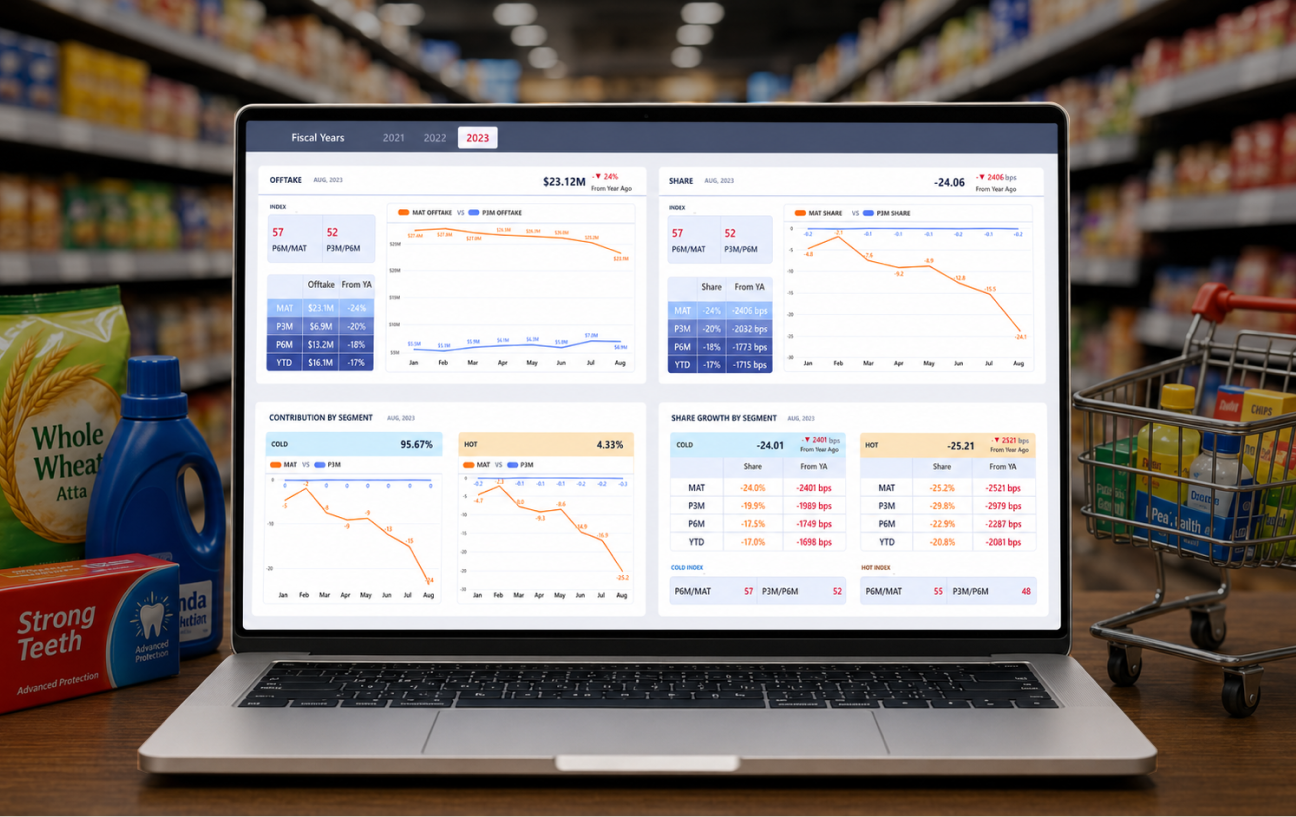
FMCG Sales Analytics Dashboard Overview
The FMCG supply chains have a chronic visibility gap, especially between dispatch and secondary offtake. Even though managers know what is shipped to distributors, they cannot track what actually moves off the retail shelves, at what margin, and when.
This delay is caused by fragmented and disparate reporting, which an FMCG sales analytics dashboard solves by unifying distributor spreadsheets, modern trade portals, and internal ERP data.
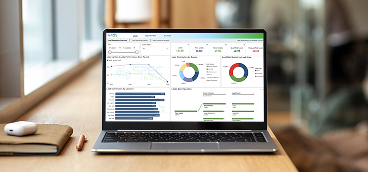
By unifying all data and adding it to a centralized Power BI FMCG dashboard, you can identify channel conflict, trade spend inefficiencies, and dead stock. Moreover, the dashboard shares the truth about regional sell-through and SKU-level profitability, presenting all information in real-time. Instead of discovering an out-of-stock crisis or margin erosion weeks after the fact, multi-region directors gain the immediate visibility required to command their distribution network and steer the quarter.
Explore the Live FMCG Sales Dashboard
FMCG Sales Dashboard Features
Sales KPI Overview
The executive module that consolidates sales, target, and channel data into a single and interactive surface. Embedded with cross-filtering capabilities, CEOs and decision makers can drill down from macro-level revenue trends to granular data analysis, effectively eliminating multi-report reconciliation and working with disjointed data.
Offtake Performance Analysis
Track secondary sales and find out at which rate inventory moves from the distributor to retail counters. For decision makers, it bridges the critical visibility gap between dispatch and actual consumption while highlighting real-time sell-through patterns.
Market Share Tracking
Market share tracking contextualizes internal sales volume against category size and competitor movements to determine your relative position in the market. Used by category managers, this feature shifts focus on vulnerable territories and capitalizes on competitor blind spots.
Product Profitability Analysis
Drill down your analysis to individual SKU level by separating high-margin products from volume-heavy deadweight categories to get immediate visibility for product management, better pricing strategies, and trade promotions.
Regional Performance Mapping
Use spatial analysis to visualize sales density, coverage gaps, and territory-wise target reports across your distribution network to pinpoint underperforming zones and identify white-space territories.
Distributor Performance Analysis
Evaluate distribution partners against pre-defined indicators and metrics like order fill rates, primary-secondary variance, and overall sales contribution for better partner evaluations, reward high-velocity distributors, and enforce accountability.

Turn Fragmented Data into an Operational Advantage
Do not let disjointed secondary sales data dictate your quarterly performance. Partner with SPEC India to deploy a custom Power BI FMCG Dashboard tailored to your high-velocity retail operations and unify data, protect margins, and rule the market with a single source of truth.
Get in TouchGoal
The primary goal of deploying a Power BI FMCG Sales Dashboard is to eliminate the critical visibility gap between primary dispatch and secondary retail offtake. By replacing fragmented, delayed spreadsheets with a unified analytics engine, we aim to empower commercial leaders with real-time operational command. This consolidated approach shifts FMCG teams from reactive data reconciliation to proactive margin protection, ensuring rapid response to shifting channel dynamics, trade spend inefficiencies, and inventory constraints.
Objectives
Eradicate delayed reporting across primary and secondary sales channels.
Minimize out-of-stock (OOS) occurrences and stranded inventory risks.
Optimize trade promotion and scheme spend for maximum gross margin yield.
Accelerate cross-functional alignment between sales, category, and supply chain teams.
Enforce quantitative accountability across the entire distributor network.
Audiences
FMCG Business Owners
FMCG Sales Directors & Managers
Trade Marketing Teams
Supply Chain Heads
Category Managers
Inventory Managers
Retail & CPG Analytics Teams
Important KPIs Tracked
Secondary sales volume
Revenue growth rate
Order fill rate
Stock in hand
Effective outlet coverage
Gross profit margin
Range selling
Distributor performance
Average order value
Explore Similar Live Visualization Dashboards
Let’s get in touch!
India
SPEC House, Parth Complex, Near Swastik Cross Roads, Navarangpura, Ahmedabad 380009, INDIA.
-
 +91-79-26404031, 32-33-34
 -
 [email protected]