

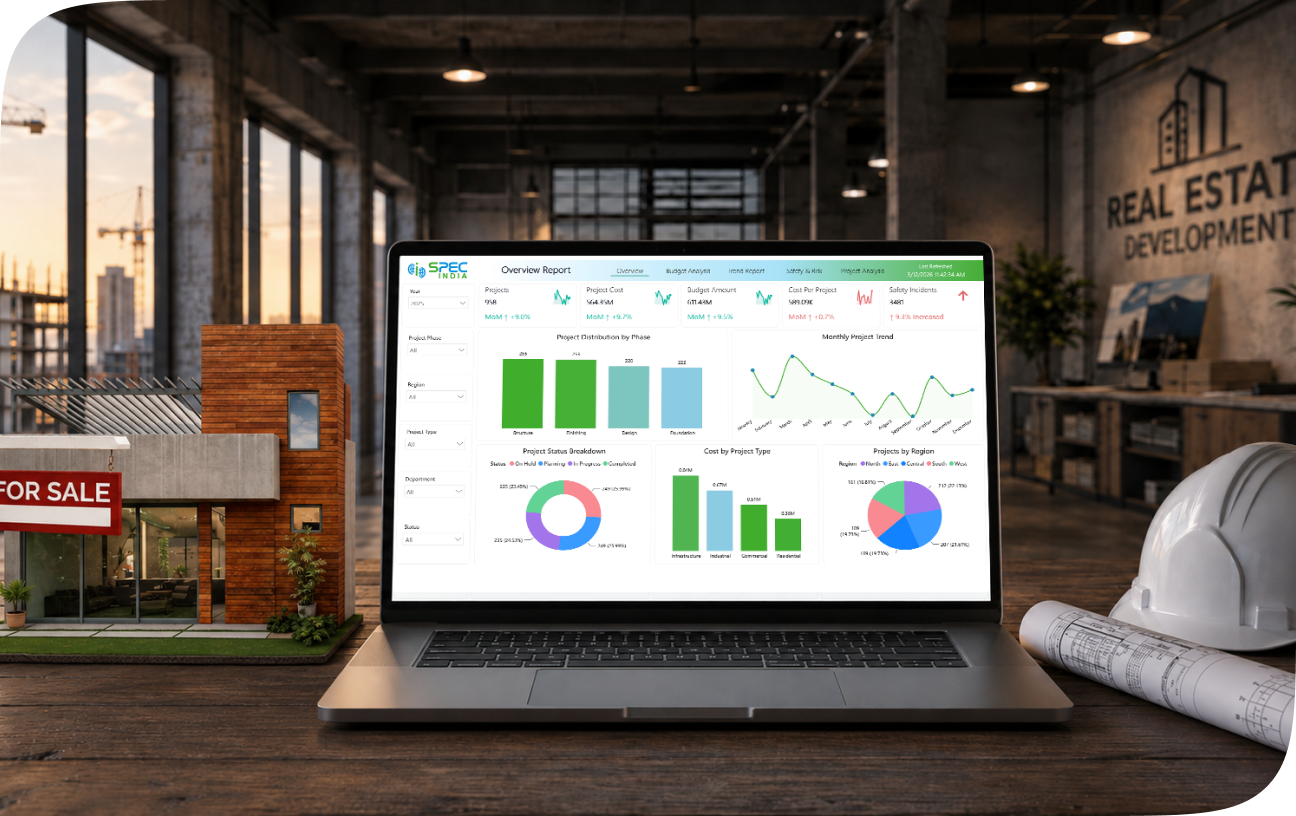
Real Estate Development Dashboard Overview
Most developers run three disconnected systems to manage their operations, including a construction tracker, a CRM, and an accounting platform. Due to this, the contractor’s spend structure and reports are available in one spreadsheet, lead conversion is in another, and cash flow is reconciled manually, which means weeks of discussions before you can make decisions that are meant to be made in real time.
This gap creates real risk, which means a managing partner can’t see that a site is 12% over budget until the ERP closes the month. A CFO can’t correlate regional price trends with unsold inventory in real time.
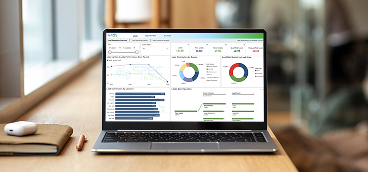
Our custom-built real estate project analytics dashboard closes this gap. Built to consolidate construction, CRM, and financial data into one secure dashboard, you will get a role-based view on the construction project Power BI dashboard, so Project Directors, CFOs, and Managing Partners see the same numbers, at the same time, across every region in the portfolio.
Real Time Real Estate Dashboard
Disclaimer: The data, characters, and brand names depicted in the visualizations are for demo purposes only. Any resemblance to actual data, or to brand names, is purely coincidental.
Real Estate Project Management Dashboard Key Features
Multi-Region Portfolio Tracking
Map every active site across regions on a single interface so that you can easily compare construction velocity, cost per square foot, and site-level performance side by side. Regional managers get local visibility, safety incident reports, and leadership gets portfolio-wide context plus project performance.
Construction and Contractor Milestones
Track project budget versus actuals at the contractor and phase level for a detailed contractor analysis. Flag schedule slippage before it compounds into penalty clauses or investor concern. Access milestone data updates directly from site reporting while eliminating manual reconciliation.
CRM & Lead Analysis
Monitor lead-to-booking conversion segregated by project, broker, and channel. Surface which sales teams and channel partners are underperforming before quarter-end reviews. Using data integration services, we can connect attribution data with marketing spend directly to closed units.
Financial & Cash Flow Modeling
Track capital deployment against construction draw schedules and investor commitments on the construction analytics solutions dashboard. Generate investor-ready reports without exporting raw data into external spreadsheets and stay updated with cash positions as they are updated in real time as the transactions post, not after month-end close.
Inventory & Sales Velocity
Use the real estate development dashboard to visualize sold, reserved, and unsold units across every project in one view. Identify which unit types or price bands are moving slowly while inventory is still adjustable, and use this data to make pricing decisions against current data, not last quarter’s report.
Predictive Cost & Price Modeling
Forecast cost overruns and regional price movement using SPEC India’s in-house AI infrastructure, using our advanced models that run on proprietary infrastructure; buyer, investor, and financial data never pass through third-party AI APIs.

Start Making Better, Faster, and More Accurate Decisions
Bring your construction projects, contractors, and all the data onto a single solution with the SPEC India real estate project management dashboard. Visualize data, see the changes in real-time, and predict outcomes using AI.
Get in TouchGoal
Our aim is to help you close the gap between site execution, financial planning, and sales performance. From regional project analysis to department analysis and project performance, Managing Partners and CFOs will get one real-time view of the entire portfolio, replacing delayed reports with current, decision-ready data.
Objectives
Prevent cost overruns through early variance detection at the contractor level
Streamline reporting workflows across construction, CRM, and finance teams
Accelerate sales velocity with real-time inventory and pricing visibility
Protect proprietary financial and investor data through secure, in-house infrastructure
Standardize reporting across regions for faster, portfolio-wide decisions
Target Audience
Managing Partners
Real Estate Developers
Project Directors
Sales & CRM Heads
CFOs and Finance Directors
VP/Director of IT
KPIs Tracked
Cost Variance (Budget vs. Actual)
Schedule Variance
Construction Progress (%)
Lead-to-Booking Ratio
Cost per Acquisition (CPA)
Sales Velocity
Unsold Inventory (%)
Cash on Cash Return
Capital Deployment Rate
Broker/Channel Conversion Rate
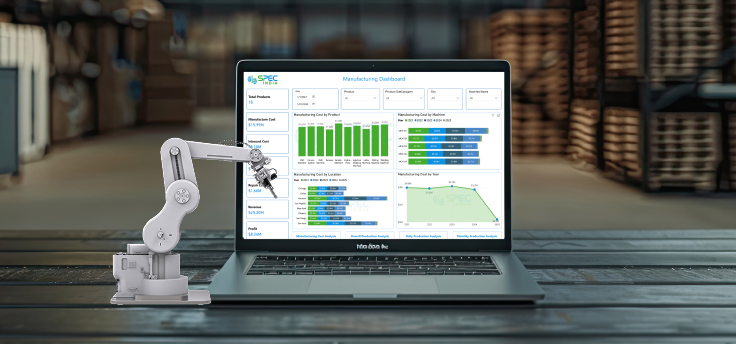
Different Industries Visualization
Let’s get in touch!
India
SPEC House, Parth Complex, Near Swastik Cross Roads, Navarangpura, Ahmedabad 380009, INDIA.
-
 +91-79-26404031, 32-33-34
 -
 [email protected]