

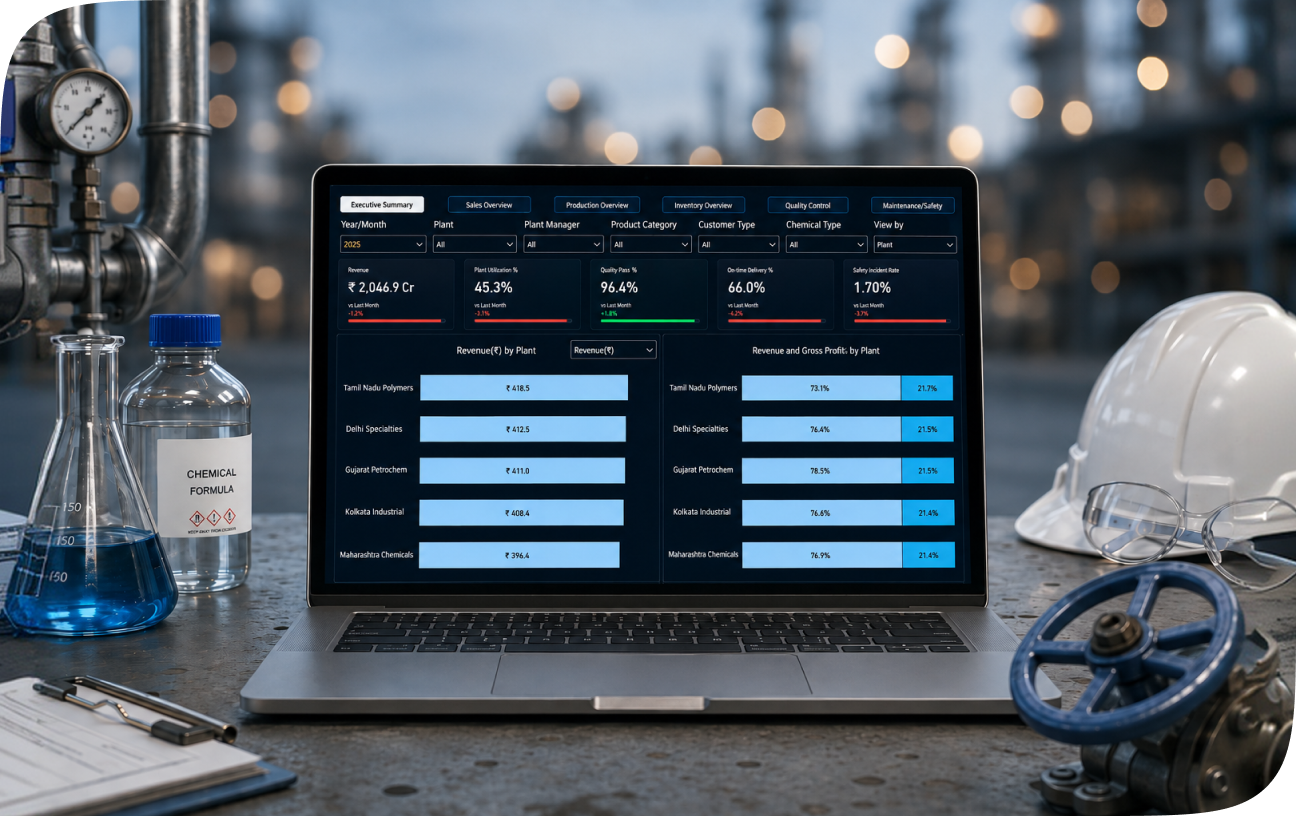
Chemical Manufacturing Dashboard Overview
Chemical manufacturers run on fragmented data as batch records sit in one system, ERP inventory in another, and quality logs in a third. This causes delays, breeds inefficiency, and inhibits progress while delaying decisions on yield variance, raw material shortages, and compliance risk until the damage is already done.
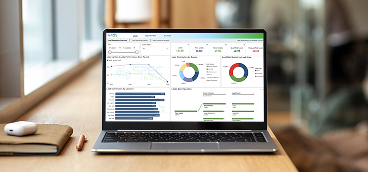
A centralized chemical manufacturing Power BI dashboard closes that gap. SPEC India connects your ERP, LIMS, SCADA, and MES sources into a single reporting layer, refreshed in real time. As a result, plant managers see batch quality trends as they happen, and the finance team sees cost-per-unit shifts before they hit the P&L. All of it runs on secure infrastructure, so sensitive formulation and process data never leaves your control.
See Our Chemical Plant Dashboard in Action
Chemical Manufacturing Analytics Dashboard Key Features
Batch Quality and Yield Analysis: Using the chemical plant performance dashboard, you can track yield variance by batch, product line, and shift. Identify recurring deviations before they affect downstream production or customer shipments.
Raw Material & Inventory Tracking: Use the dashboard to monitor stock levels, reorder points, and supplier lead times across multiple warehouses. Reduce overstocking and prevent line stoppages from material shortages.
Equipment Utilization and OEE: Measure availability, performance, and quality rate per production line with a custom-built chemical manufacturing analytics solution to pinpoint which equipment or shifts drag down overall output.
Cost and Margin Tracking: Visualize a detailed breakdown of down cost per batch, per unit, and per product line. Connect production inefficiencies and revenue by plant directly to margin impact and run gross profit analysis.
Predictive Maintenance Insights: Surface early signs of equipment wear using historical sensor and maintenance data when connected to the dashboard. SPEC India’s in-house AI infrastructure powers these predictions without routing your operational data through third-party APIs.
Energy and Resource Consumption: Monitor utility usage, water consumption, and waste output per batch through the chemical plant KPI dashboard.

Consolidate Your Data and Predict Outcomes
Fragmented data slows down every decision on your plant floor. SPEC India brings 39 years of enterprise software delivery and in-house AI infrastructure, so predictive insights stay inside your environment. No third-party AI APIs, no exposure of formulation or process data. Transparent timelines, direct communication, and support that continues after go-live.
Get in TouchGoal
Our goal with chemical plant <a href="https://www.spec-india.com/services/business-intelligence-services">BI dashboard development</a> is to give leadership a single, secure view and real-time visibility of production, quality, and compliance data. The dashboard is meant to support decision-making related to plant operations, safety, and KPIs. We aim to replace your existing delayed and siloed reporting systems with real-time dashboards that support faster, lower-risk operational decisions. With a single dashboard, we want to help you maintain quality standards of your product, ensure plant safety, be compliant, and increase profit margins.
Objectives
Consolidate ERP, MES, LIMS, and SCADA data into one Power BI environment.
Reduce time spent on manual, spreadsheet-based reporting and replace it with real-time analysis.
Detect yield and quality deviations before they escalate and cause more damage than repairable.
Display active alarms for chemical leaks, over-pressure, and toxic releases.
Strengthen regulatory audit readiness with centralized compliance tracking.
Protect proprietary formulation and process data through in-house AI infrastructure.
Audiences
Plant Operations Directors
CFOs and Finance Controllers
CTOs/CIOs and IT Directors
Quality Assurance Managers
EHS (Environmental, Health & Safety) Officers
Supply Chain and Procurement Leads
KPIs Tracked and Analyzed
Yield Variance
First Pass Yield
Overall Equipment Effectiveness (OEE)
Cycle Time per Batch
Cost per Unit
Capacity Utilization Rate
Inventory Turnover
Supplier On-Time Delivery Rate
Regulatory Compliance Rate
Unplanned Downtime Hours
Explore More BI Visualization Dashboards
Let’s get in touch!
India
SPEC House, Parth Complex, Near Swastik Cross Roads, Navarangpura, Ahmedabad 380009, INDIA.
-
 +91-79-26404031, 32-33-34
 -
 [email protected]