


UAE
Tableau Online, Tableau Desktop, Oracle, Tableau Prep
Life Style
The project is about developing a business intelligence and analytics application for a popular fashion brand and clothing and accessories company in the Middle East with its headquarters based in Kuwait. It operates in 6 countries with around 15 brands, having around 140 stores with a variety of clothing, luxury, accessories, footwear, and fast fashion brands.
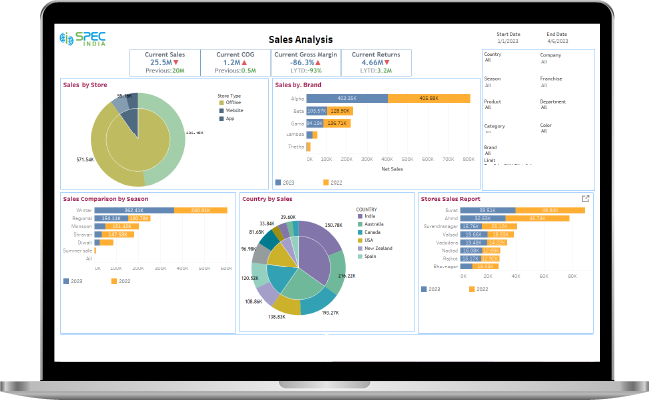
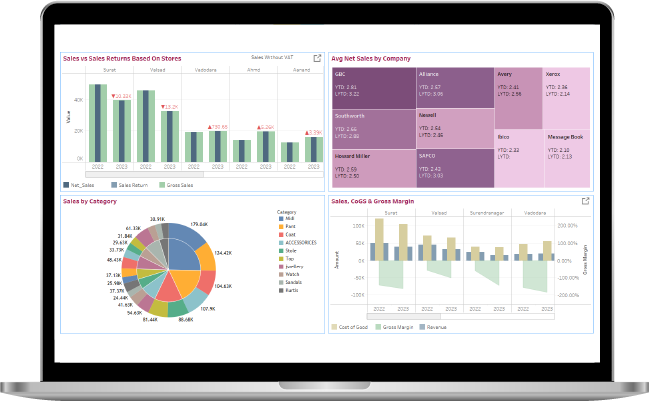
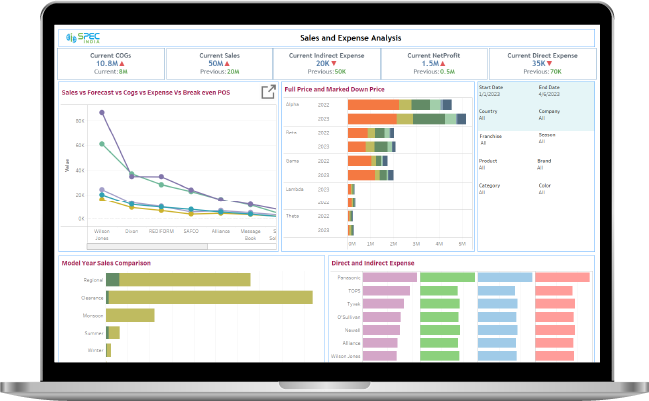
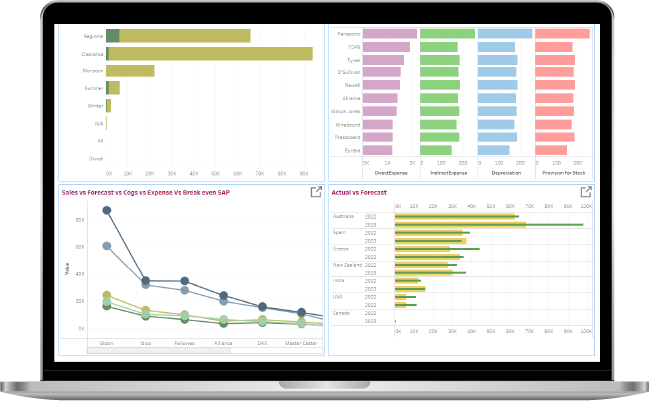
They were keen to design and develop a business intelligence solution that can help the organization in effectively analyzing expense-related details like closing amount balance, profit & loss, expense-related KPIs, etc.
The client was finding it difficult to come up with a set of reports and dashboards that could give them a detailed insight into their expense-related KPIs and details. They had huge data coming from different databases located at different locations and maintaining the performance of the dashboard was difficult. They also wanted to offer a background to specific columns of the table and fetch the image of the product once clicked on the dashboard.
SPEC INDIA understood the requirements and recognized the challenges faced by the client. The client offers a flexible expense monitoring portal that gave insightful details about different facets of expenses borne by the business at different locations.
Key Components
We used Tableau Actions to fetch images based on the clicked product. We made sure to hide the unused fields from the data source to increase the performance of the dashboard and the extracts.
We customized the existing views of Tableau and implemented a visual component that provides background to the specific columns of the table.
Different background to table columns
Expense based KPIs
Closing amount balance
Fetching product-based image
Our solution enabled the business to achieve the following benefits:
Easy monitoring of expenses in different stores
Monthly, quarterly, yearly monitoring of expenses
Comparison of closing balance Vs budget allocation
Enriched graphical user interface (GUI)
User-specific, effective, and well-optimized visualization and dashboards
Optimal performance of dashboards with complex visualization
SPEC House, Parth Complex, Near Swastik Cross Roads, Navarangpura, Ahmedabad 380009, INDIA.

This website uses cookies to ensure you get the best experience on our website. Read Spec India’s Privacy Policy