


India
Power BI, Azure SQL Database, SQL Server
Finance and Employee Safety for Enterprise
The project is about developing a Power BI based software application for a popular IT and business transformation organisation who is digitally transforming the competitiveness of manufacturing industry through intelligent business transformation platforms.
The platform hosts a set of tools to reveal cost efficiencies, revenue growth and capital productivity. They have certain products like sales-related products, process related products that leverage technology to utilize transformation tools, methods, and knowledge.
They were keen to design and develop a business intelligence solution that can integrate seamlessly with their products and offer a great deal of flexibility to users, to see details of all calculations and metrics of margins, pricing in a modular format and monitor performance with efficacy.
The client was finding it difficult to visualize different reports based on parameters. They were looking for a business intelligence application that could use complex features in Power BI, Customer Churn, and designs of column chart features. It was difficult for them to analyze the KPIs of sales data in terms of reports and dashboards.
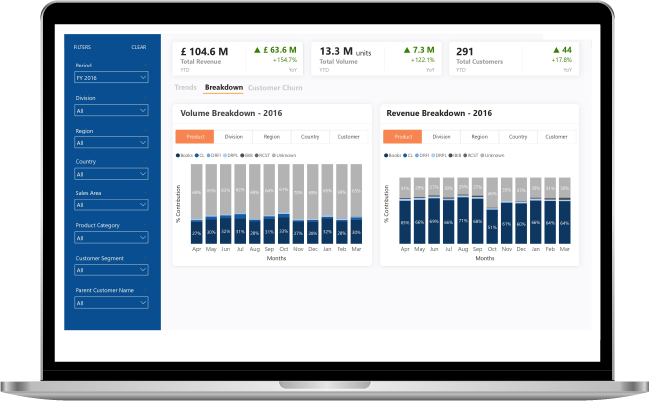
As a dedicated team-based model, we have offered a range of Power BI reports for activities in the manufacturing and finance industry. We have offered KPI-based reports that calculate Margins (Contribution, Gross), Net Profit, Pricings (Gross, Net, Discount) etc.
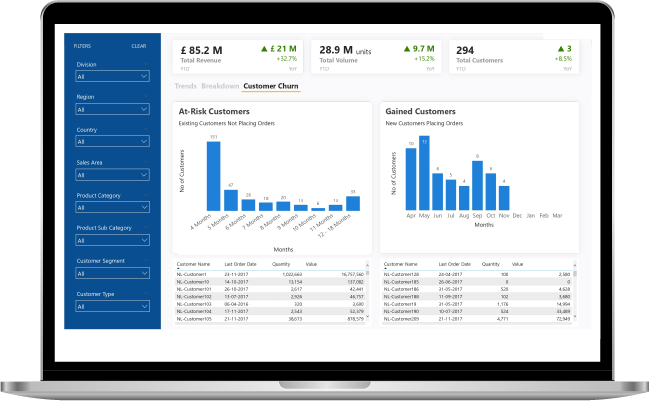
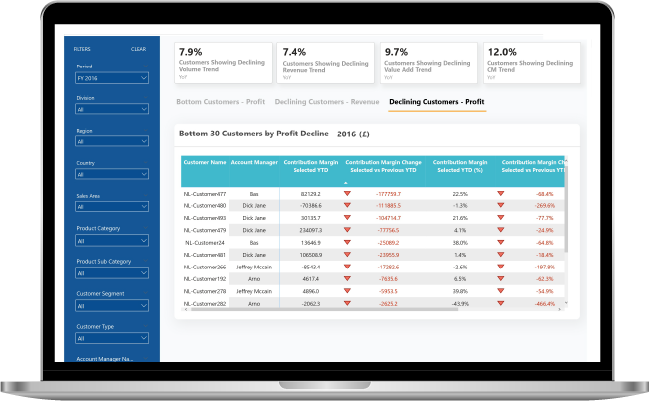
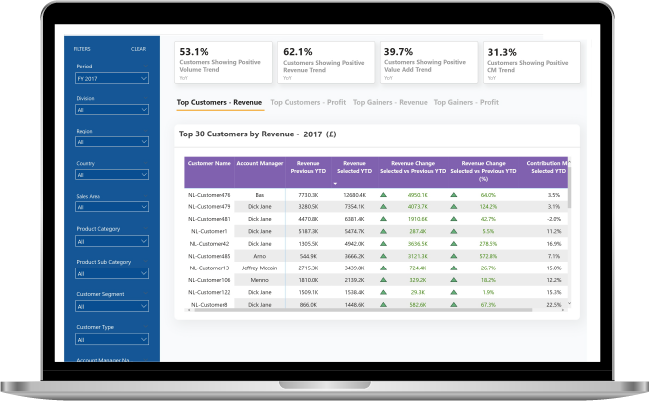
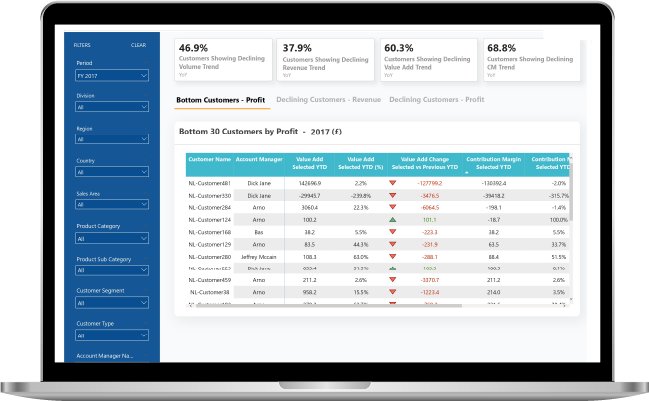
We have provided Customer Churn by using SQL + Measure solution and for column chart we made tweaks in existing chart to make it look like a column chart as per requirement. It also includes reports that show top and bottom customers showing positive/declining volume/revenue/value add trend.
Money Makers: To determine products and other entities which are generating positive sales for organization
Loss Makers: To determine products and other entities which are running in loss or having less margin
Sales Team Performance: To determine pricing details and margins by salesman to track performance
Our solution enabled the business to achieve the following benefits:
Detailed view of products that need improvement in margins and sales to generate profit
Insights in an interactive manner
Faster decision making on product impact
Increased digitization inputs
Viewing dashboards on an ongoing basis
Futuristic view of business information
Dynamic representation and interaction with data
Business growth and job creation
SPEC House, Parth Complex, Near Swastik Cross Roads, Navarangpura, Ahmedabad 380009, INDIA.

This website uses cookies to ensure you get the best experience on our website. Read Spec India’s Privacy Policy