


France
Tableau Prep, Tableau Dashboard, PostgreSQL
Quality Management, Safety & Health Management
The project is about developing a business intelligence and analytics application for a world leader in laboratory testing, inspection, and certification services. It has around 1,600 offices and laboratories around the globe. It assists its clients to improve their performance by offering services and innovative solutions to ensure that their assets, products, infrastructure, and processes meet standards and regulations in terms of quality, health and safety, environmental protection, and social responsibility.
It is a French company that operates in a variety of sectors, including building and infrastructure, agri-food, and commodities, marine and offshore, industry, certification, and consumer products.
They were keen to design and develop a business intelligence solution that can integrate seamlessly with a huge amount of data and offer an end-to-end set of reports and dashboards that can show user-specific data visualization.
The client was finding it difficult to come up with a set of reports and dashboard that has complex visualizations, a huge amount of data, and can load easily in optimal time. Integrating third-party applications into the Tableau dashboards was difficult. Also, combining data from multiple files and data sources, in different formats was a tough task.
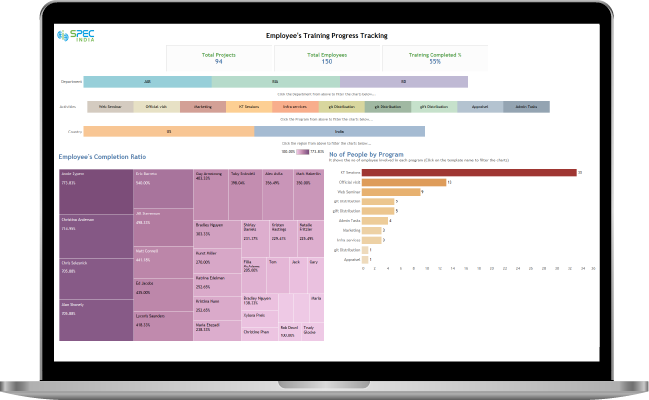
SPEC INDIA understood the requirements and recognized the challenges faced by the client. We offered an end-to-end business intelligence solution with the best of Tableau visualizations to track employees training progress, sustainability of programs etc. for technical and project management teams.
Key Components
We did pre-processing & cleaning of data in Tableau Prep to convert data into a uniform format. We fetched data from third-party applications into Tableau using a Web data connector.
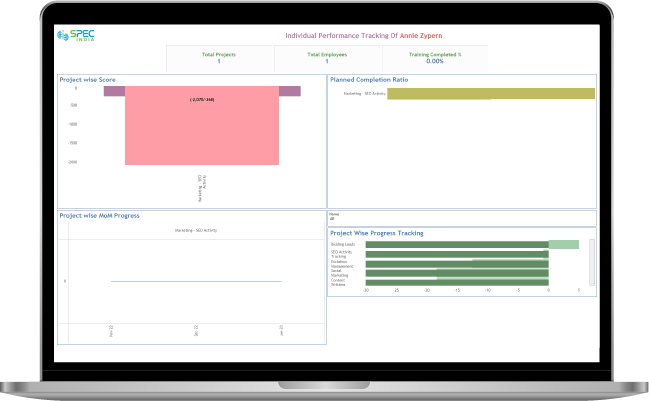
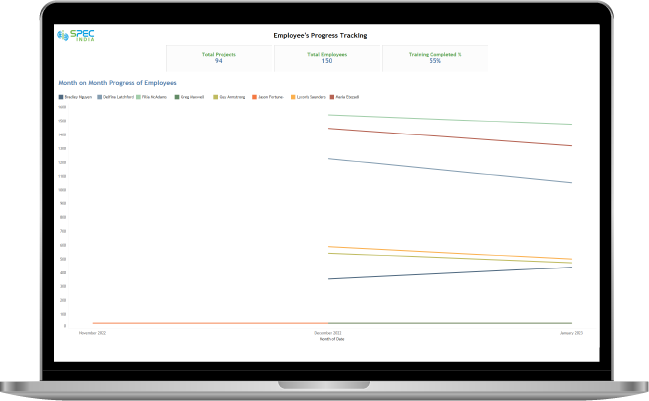
Tracking employee progress and productivity
Program sustainability
Getting data in a uniform format
Data cleansing and processing
Seamless integration with external applications
Our solution enabled the business to achieve the following benefits:
Employee involvement in different programs
Easy tracking of employee productivity
Derivation of sustainable and non-sustainable programs
Estimated completion based on MoM progress of employees
Track Paid Time Off (PTO) leave of employees
Optimal performance of dashboards with complex visualization
User-specific, effective, and well-optimized visualization and dashboards
Enriched graphical user interface (GUI)
Real-time status of assigned activities of users
SPEC House, Parth Complex, Near Swastik Cross Roads, Navarangpura, Ahmedabad 380009, INDIA.

This website uses cookies to ensure you get the best experience on our website. Read Spec India’s Privacy Policy