


Switzerland
Microsoft Power BI, Power BI Custom Visual, Visual Studio (Typescript), HighCharts library
Trading & Shipping
The project is about developing Power BI-based software applications for one of the global leaders in commodity and oil product negotiation. It is recognized for its expertise from Singapore to Houston, via Geneva and Paris. They are financial and logistics experts for the oil markets, with involvement in all international energy flows.
They were keen to design and develop a business intelligence application that can track the daily stocks of oil-related categories and forecasted values of stocks based on different parameters. They were keen to have custom visualization reports and dashboards that could give them almost real-time information based on the input parameters as desired by users.
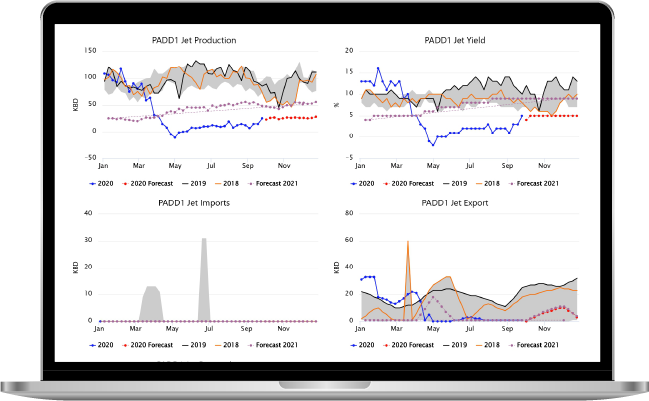
Our Power BI-based software solution aims at providing detailed insight into daily oil stock values by creating custom visualization for Power BI. We have implemented a range area and line chart, in which the range area is shown for an average number of years that is dynamic and the line chart is for the current year.
Key Components of Power BI Application
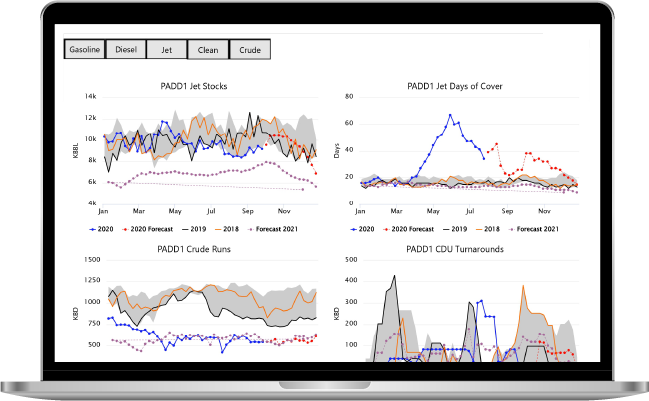
We have created multiple custom visualizations as per the needs of the client in HighChart.js, by using the open-source library and offering features to change the parameters as needed, showing the actual and forecasted values.
Reports and custom charts can be generated based on a range of years input by the users, that are based on a drop-down list. Customization can be done based on axis, tooltip, range or any other parameter, as desired by the users. Unpivoted data is imported from excel files and then the range is calculated by custom charts without any need for a DAX or Power Query.
Forecast line charts and range area charts
Custom charts
Range of years report
Customization based on axis, line, tooltip, range etc.
Range calculation by the custom chart


The business gained the following benefits from our project solution
Better stock investments and decision making
Easy reach to certain customers for specific products
Boosted sales for a range of products belonging to a specific area, category etc.
Further reach to clients and potential buyers
Visually appealing dashboard and reports
Real-time information at one glimpse for all participants
Futuristic perception and insightful business decisions
Faster evaluation and better organizational efficacy
Enhanced decision-making for better sales tracking
SPEC House, Parth Complex, Near Swastik Cross Roads, Navarangpura, Ahmedabad 380009, INDIA.

This website uses cookies to ensure you get the best experience on our website. Read Spec India’s Privacy Policy