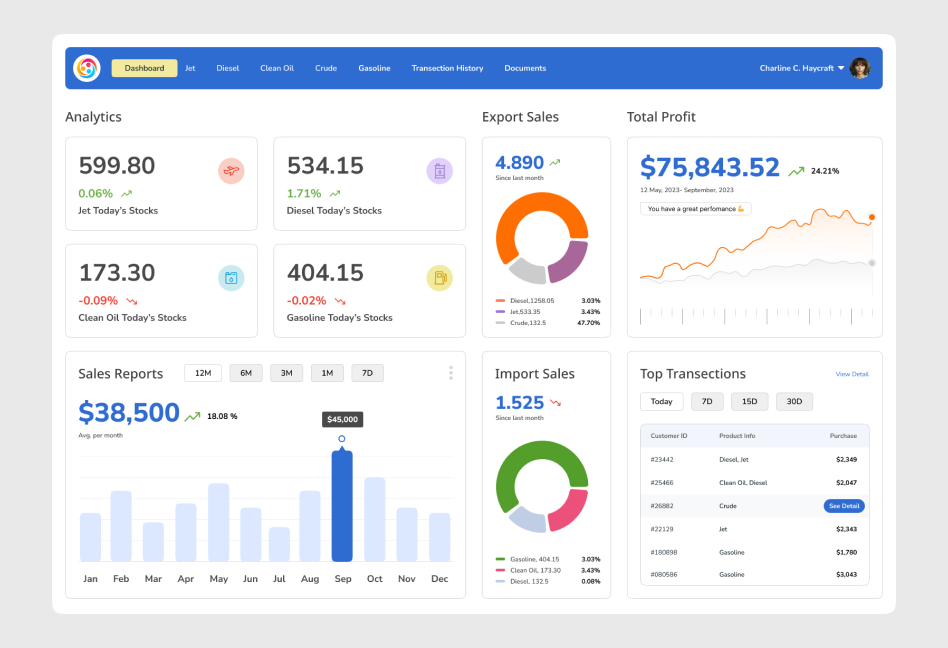

The client is a trading and shipping company located in Geneva with specialization in trading and management of oil products. They are present in the global energy market and require a tool that can help them analyze their date so that they can make decisions faster. Hence, they asked us for a business intelligence solution which can help them to have a track of each essential data.

The primary and overall purpose of the client was to develop a Business Intelligence (BI) system that would update daily oil stock values and have the capability to forecast future stock values incorporating some factors.
The client had trouble showing their business data clearly because Power BI’s basic charts were too limited, making it hard to understand important information.
Because of these visualization issues, the client couldn’t quickly respond to changes in the oil supply chain, which is vital in the fast-moving energy market.
The difficulty in visualizing data made it harder for the client to keep up with the growing global demand for energy, affecting their efficiency.
The client needed a solution that allowed them to create more customized visuals to meet their specific business needs, which Power BI’s standard features couldn’t fully support.
We opted for the Agile method which means that the process can be broken down into smaller parts or phases, and this helps to respond to the needs of the client faster.
We initially began by investing our time to understand what the client requires and then identify the most suitable solutions for their problems. This planning ensured that we had the right solution to fit for this problem.
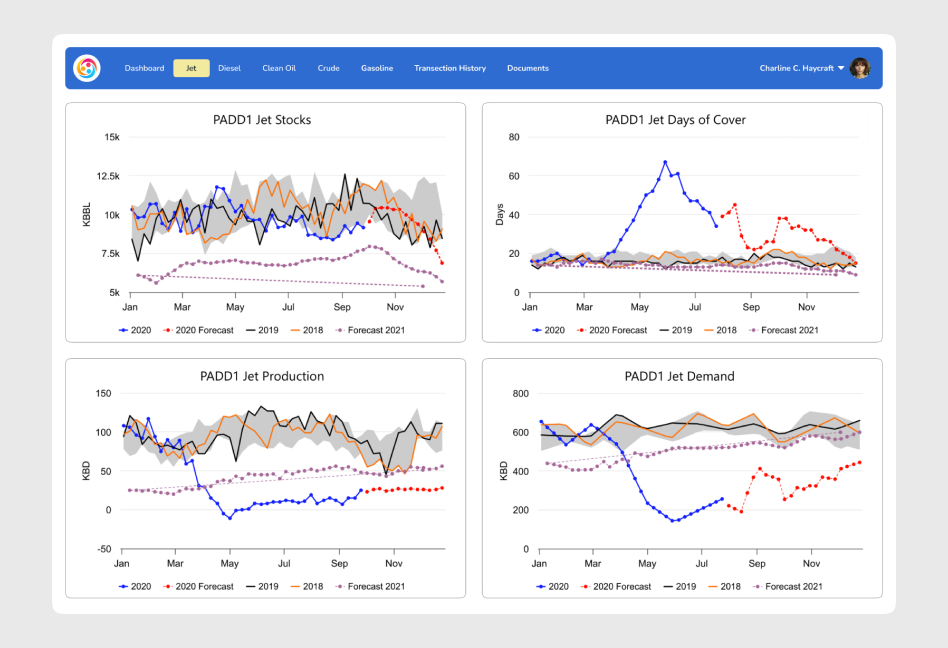
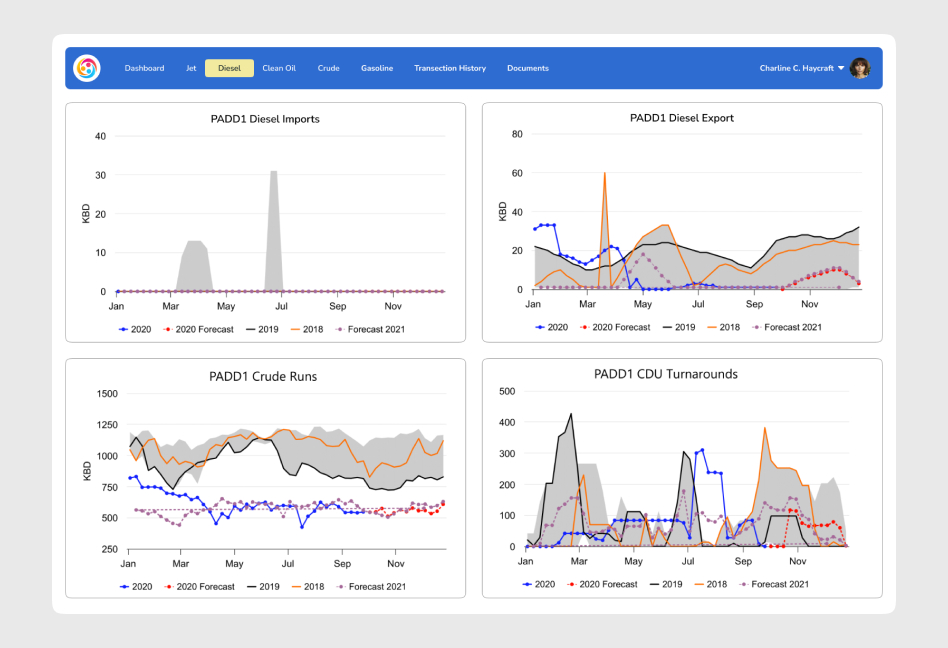
We built a Power BI application with custom visuals like forecast line charts and range area charts, using the HighCharts library to match exactly what the client needed.
The custom visuals we made included features like adjustable settings, dynamic range calculations, and real-time data updates, giving the clients the tools they needed to make smart decisions.


The Power BI solution made it easier for the client to track and predict oil reserve levels accurately.
Custom charts helped the client understand their data better, leading to smarter decisions.
The solution made the organization run more smoothly, speeding up processes and evaluations.
The client could make better decisions about stock investments, resulting in better outcomes.
SPEC House, Parth Complex, Near Swastik Cross Roads, Navarangpura, Ahmedabad 380009, INDIA.

This website uses cookies to ensure you get the best experience on our website. Read Spec India’s Privacy Policy