


Power BI Solution for an Ireland Based Data Analytics Company
Project Overview
The project is about developing a Power BI-based software Solution for an advanced information strategy specialist and data analytics advisory. They were keen to design and develop a business intelligence solution that can track different parameters like daily sales, returns, supplies.
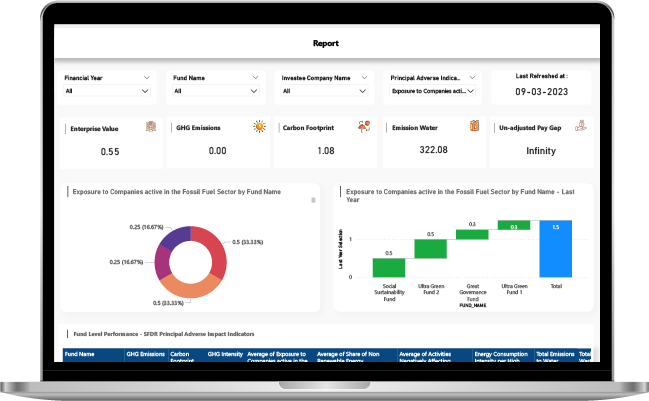
Our Power BI-based software Solution aims at providing detailed insight into online & offline newspaper views, distribution, media consumption, etc. We developed an automation process to get & transform data using Azure Data Factory & Logic Apps/Power Automate for designing and developing of ETL, from which data was inserted into Snowflake which was used to develop Power BI Dashboards.
Key Components of Power BI Application
- Alerts for any wrongful action
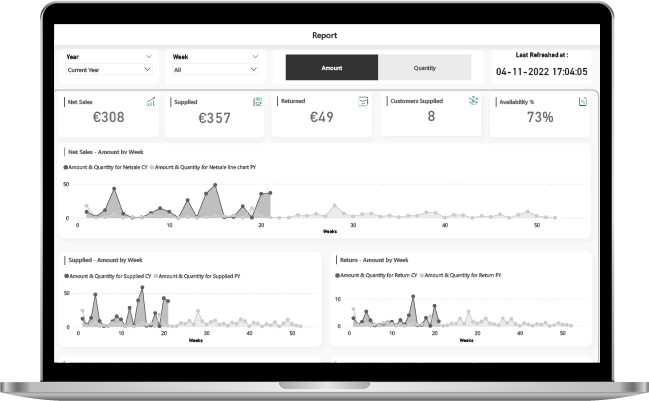
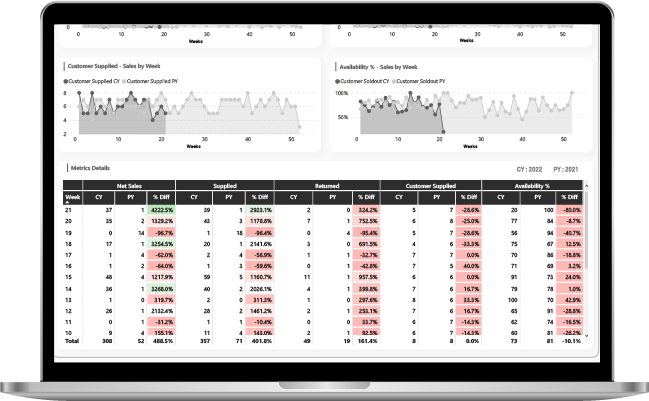
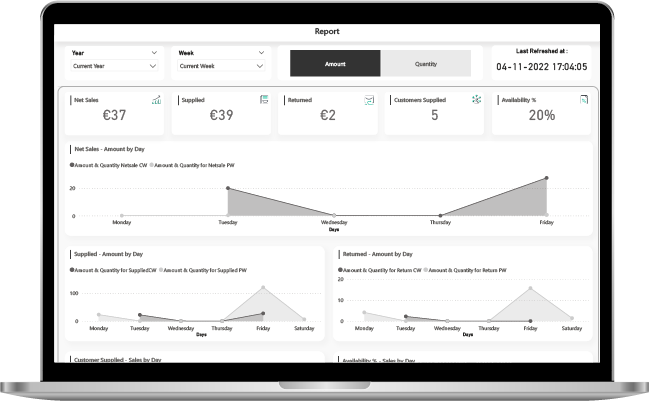
- Daily sales, returns, supplies, customer availability
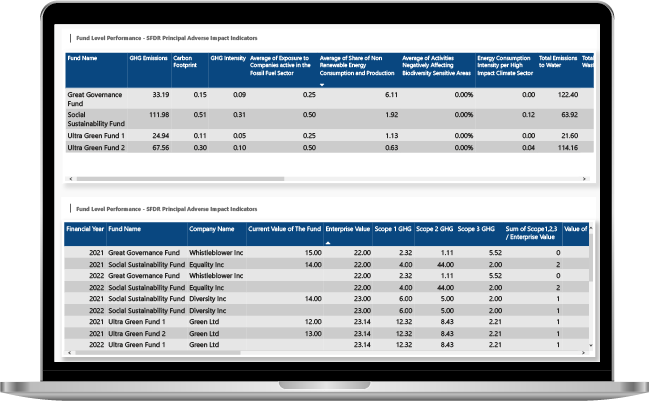
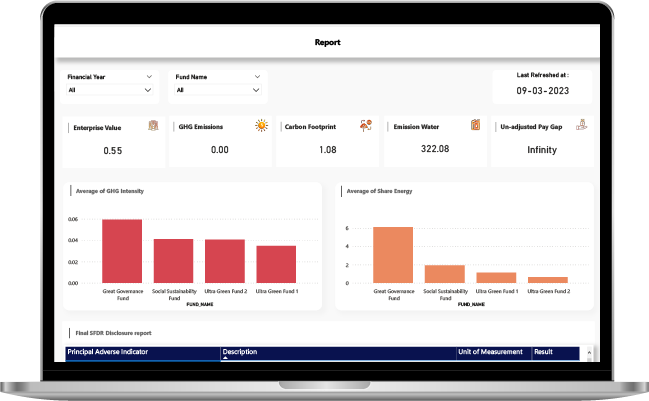
- Insightful and alluring dashboards and reports
- Utilization of Power Apps, and other apps
Core Features
We created complex Data Analysis Expressions (DAX) considering each section of filter and amount/value selection based on KPIs. We utilized ADF and Logic App for getting number of rows and sending mail alerts. We leveraged the cloud-based Snowflake database for database usage. We used Power Apps for write back functionality to Snowflake by creating UI/UX like Power BI table and using custom connector in Power Apps for connecting to Snowflake.
Key Inclusions
Mail alert comparing the number of rows
Merging different models into a single report
Report to write back values to Snowflake DB
Complicated DAX
Data automation and transformation
Screens
Technologies And Platform We Use

Business Benefits
The business gained the following benefits from our project solution
Better sales supplies and returns management
Decision making in newspaper frequency
Easy reach to specific customers for specific products
Increased sales for a range of products belonging to a specific area, category, etc.
Additional reach to clients and potential buyers
Visually appealing dashboard and reports
Real-time information at one glance for all stakeholders
Futuristic perspective and insightful business decisions
Faster analysis and better organizational efficacy
Enhanced decision-making for better sales tracking
Let’s get in touch!
India
SPEC House, Parth Complex, Near Swastik Cross Roads, Navarangpura, Ahmedabad 380009, INDIA.
-
 +91-79-26404031, 32-33-34
 -
 [email protected]
