


India
Microsoft Power BI, Azure Cosmos DB, R
Water & Sanitation
The project is about developing a Power BI-based software application for a popular department that manages the water supply and sanitation across villages, districts, and states. They oversee the monitoring of water supply activities across the nation. They focus on integrated demand and supply side management of water at the local level, including the creation of local infrastructure for source sustainability like rainwater harvesting, etc.
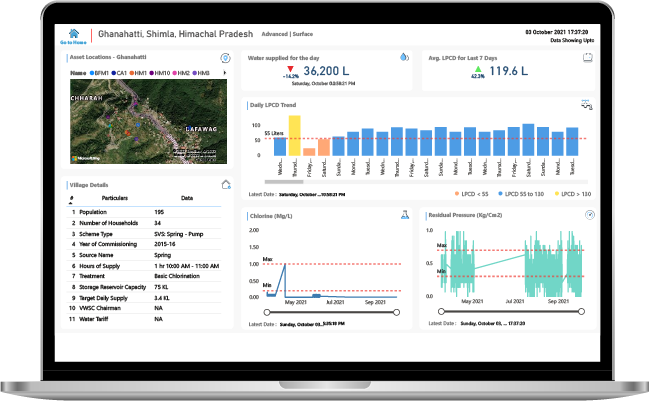
They were keen to design and develop a business intelligence solution that can track enabling all households to have access to and use safe & adequate drinking water within premises to the extent possible. They were keen to have custom visualization reports and dashboards that could give them almost real-time information based on the input parameters as desired by users. They wished to track daily water supply, Chlorine level, and water pressure insights for each location and look at the average daily LPCD (litre per capita per day) of each household in each location.
They were looking for a business intelligence application that could consolidate data from each location and portray it as a single output. An application that can manage error logs of all IoT devices.
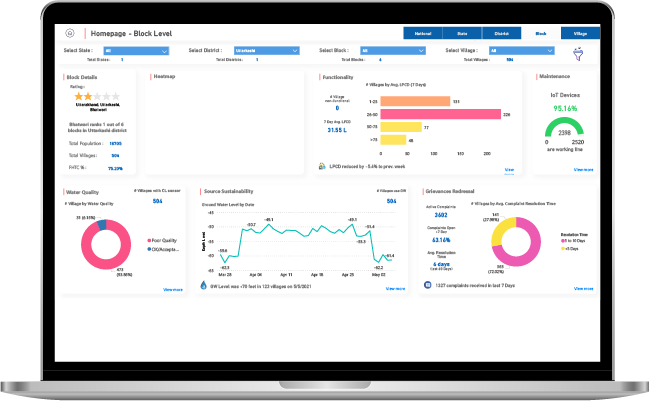
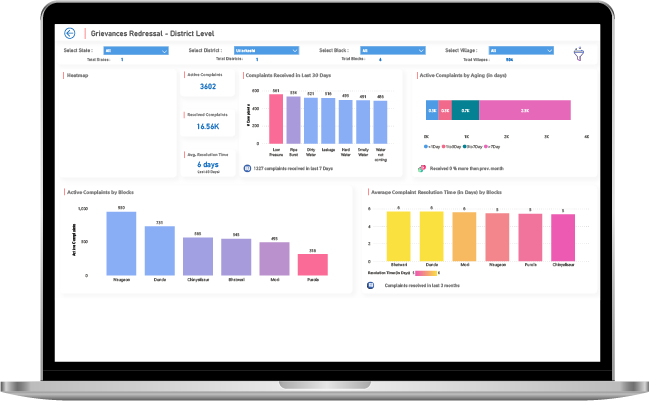
Our Power BI-based software application provides daily water supply, water pressure, water chlorination, and devices online/offline insights considering each household. We developed dashboards related to the water supply that got embedded in the website & multiple POC dashboards as per requirement for more insights on the water supply to villages.
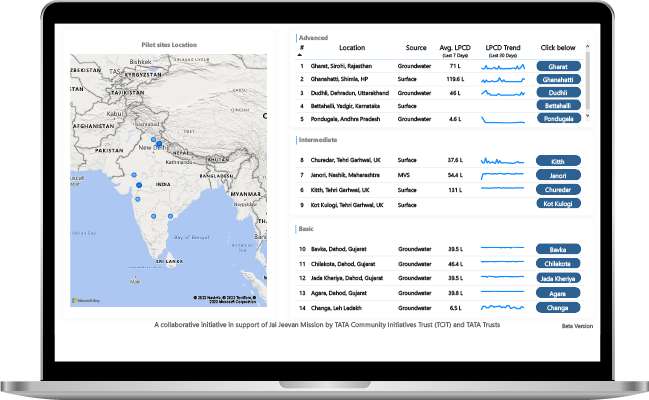
We implemented the IoT infrastructure in pilot sites where each sensor device sends data to the Azure Cosmos database using local gateways available at the site, later used in the Power BI dashboards. These IoT devices are installed to get data of water supplied, pressure, chlorine value, water source depth, etc.
We used different layouts to consolidate data at different levels with a drill-through facility and page navigation functionality. With CosmosDB as the data source, a live dashboard has been created to monitor each site and its metrics.
Graphical representation of the progress of households with the supply of water
Status of water supply in districts, blocks, panchayats, villages
Status of households with tap water connection (as on date)
State-wise villages with tap connections, villages certified
Tap water connection provided since the start of the mission
Status of tap water supply in rural homes
Government live dashboard/internal dashboard with KPIs
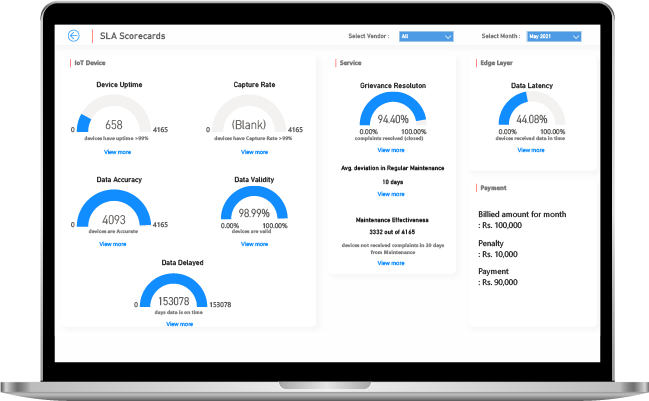
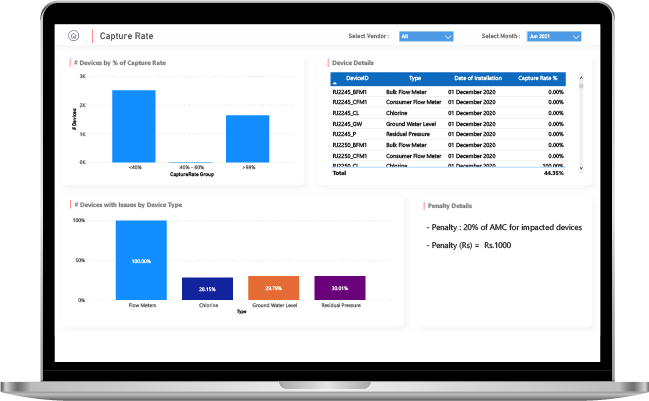
SLA Scorecards


SPEC House, Parth Complex, Near Swastik Cross Roads, Navarangpura, Ahmedabad 380009, INDIA.

This website uses cookies to ensure you get the best experience on our website. Read Spec India’s Privacy Policy