

Tracking and Analytics Portal for Testing & Inspection Firm
Our client from South African were keen to design and develop a business intelligence solution that can integrate seamlessly with a huge amount of data and offer an end-to-end set of reports and dashboards that can show user-specific data visualization.
-
Industry
Quality Management, Safety & Health Management -
Country
South Africa
Technologies
Years In Business
Projects Delivered
Happy Clients
Countries Served
Business Goals
- Build a unified analytics portal to consolidate dispersed project, employee, and training data, enabling real-time, data-driven decision-making.
- Track individual employee performance and training progress to identify gaps, enhance productivity, and support continuous improvement.
- Automate data cleansing and integration from multiple sources to deliver consistent, accurate, and visually rich reports via advanced BI tools.
Business Challenges
Complex Visualizations with Performance Bottlenecks
The client struggled to create dashboards that could handle large datasets and complex visualizations while maintaining fast loading speeds and optimal performance.
Fragmented Data Sources and Integration Issues
Merging data from multiple files in varied formats and integrating third-party applications into Tableau dashboards proved to be technically challenging and time-consuming.
Technical Solution
-
End-to-End BI Solution with Custom Tableau Dashboards
We delivered a tailored business intelligence platform using Tableau, enabling technical and project teams to track training progress and sustainability effectively.
-
Data Pre-processing with Tableau Prep for Uniformity
We used Tableau Prep to clean and standardize data from varied sources, ensuring consistency and reliability across all visualizations and reports.
-
Seamless Third-Party Integration via Web Data Connector
To overcome integration challenges, we implemented Tableau Web Data Connectors to pull data directly from third-party applications into the dashboards.
Project Glimpse
Features
PTO Data Tracking
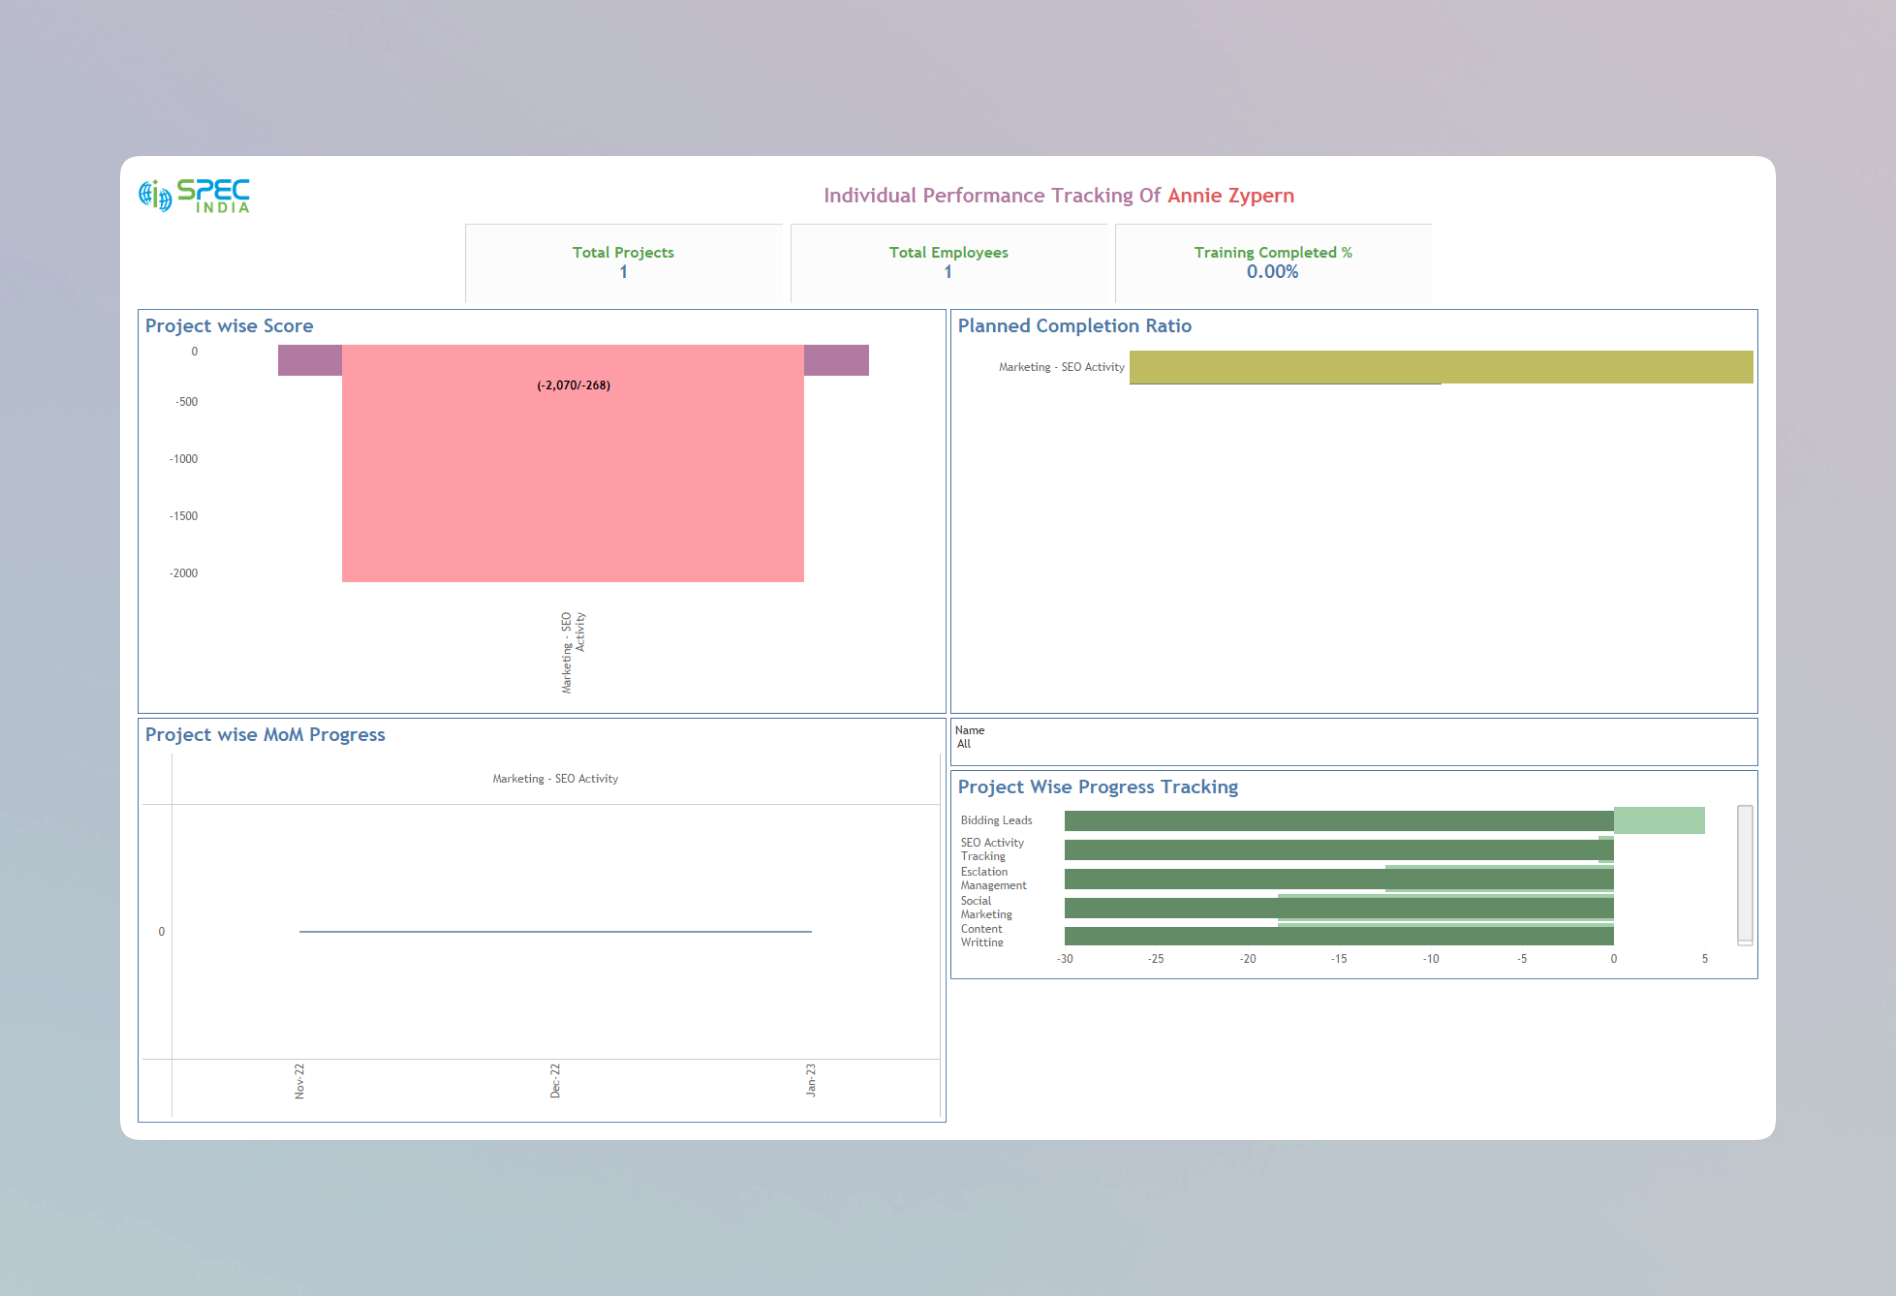
Individual Performance Monitoring
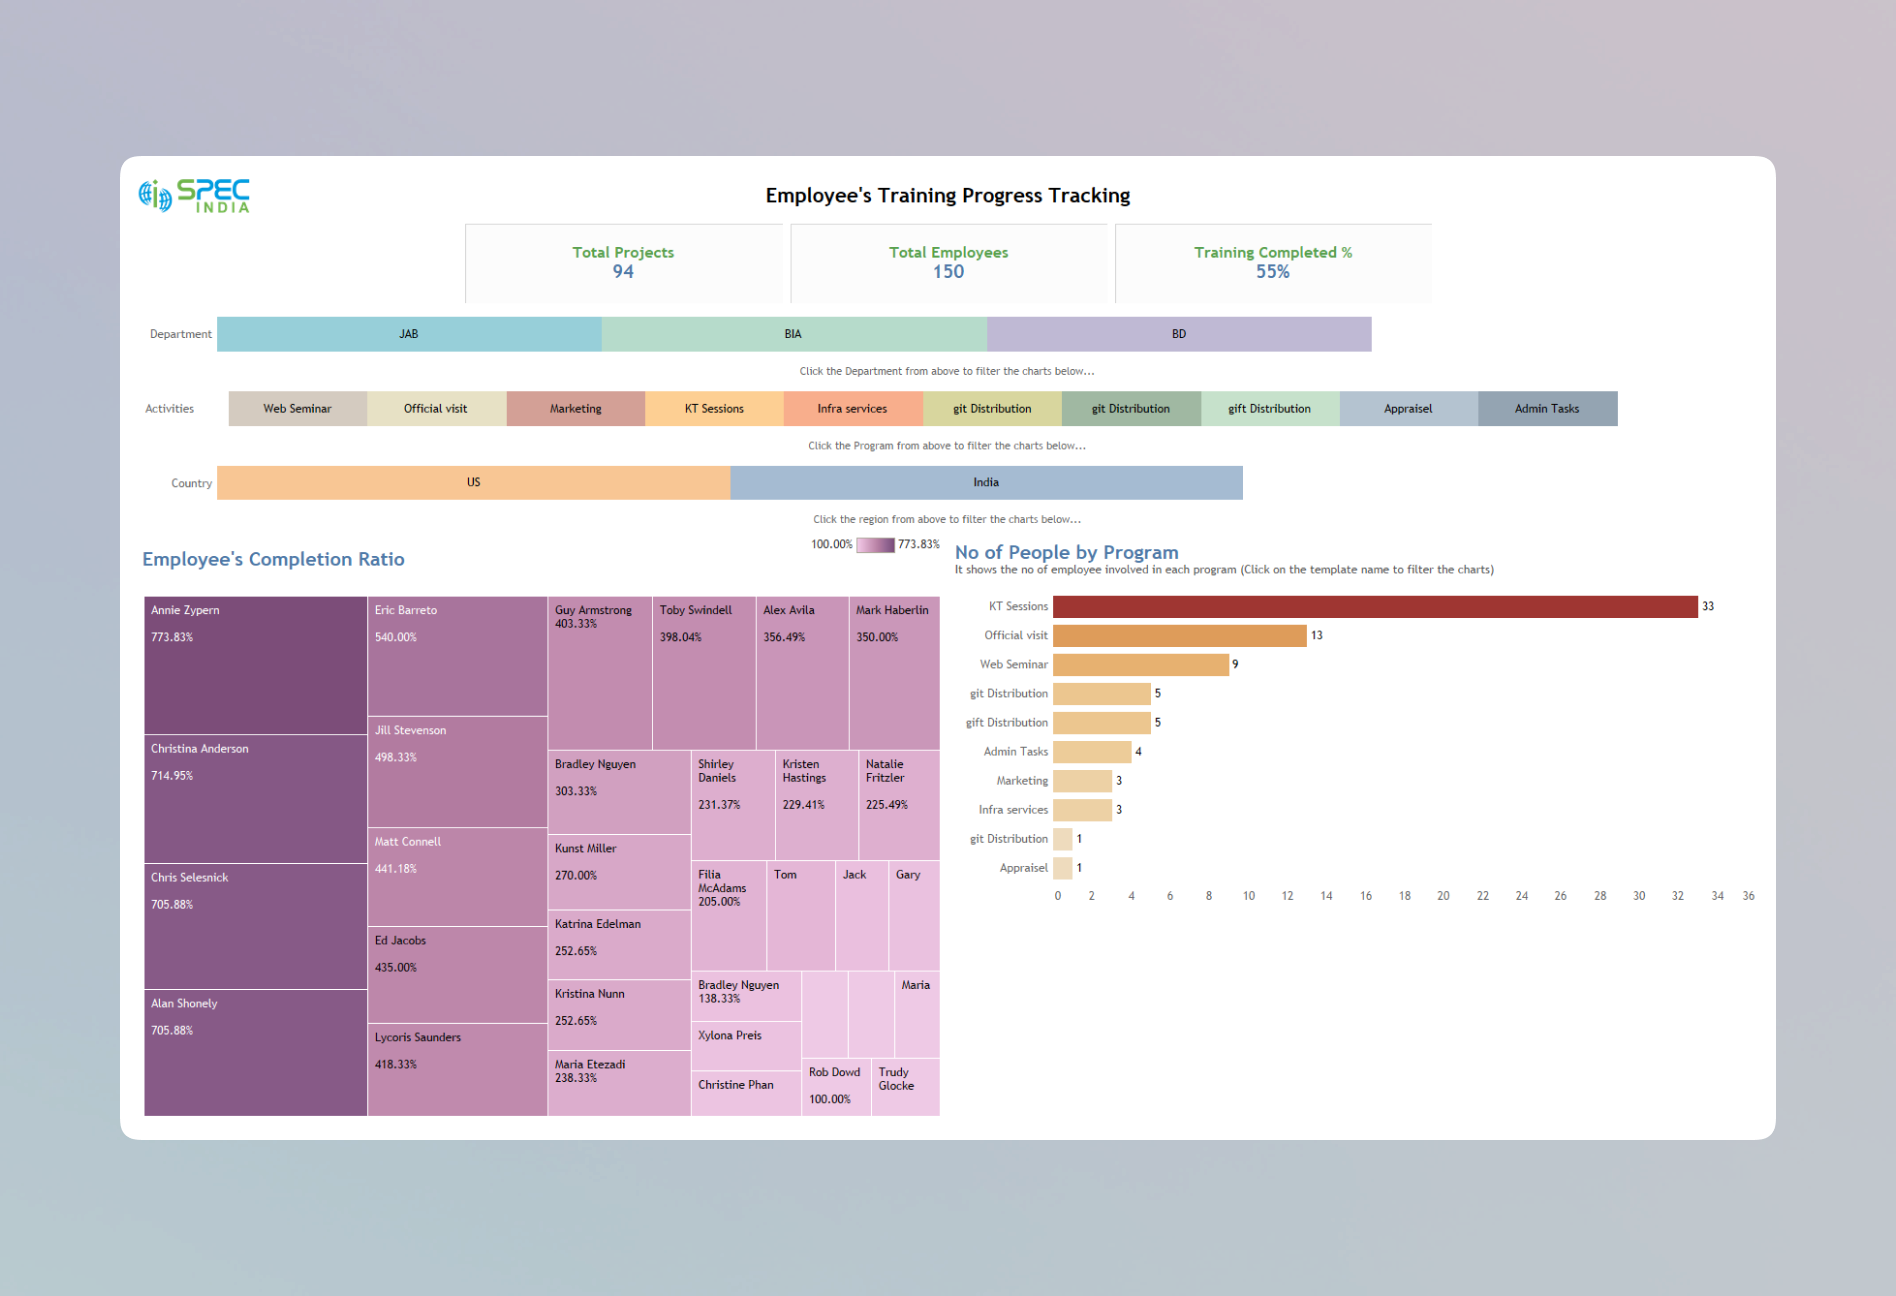
Employee Training Progress Analysis
Learning Summary Reporting
Project Management Performance Tracking
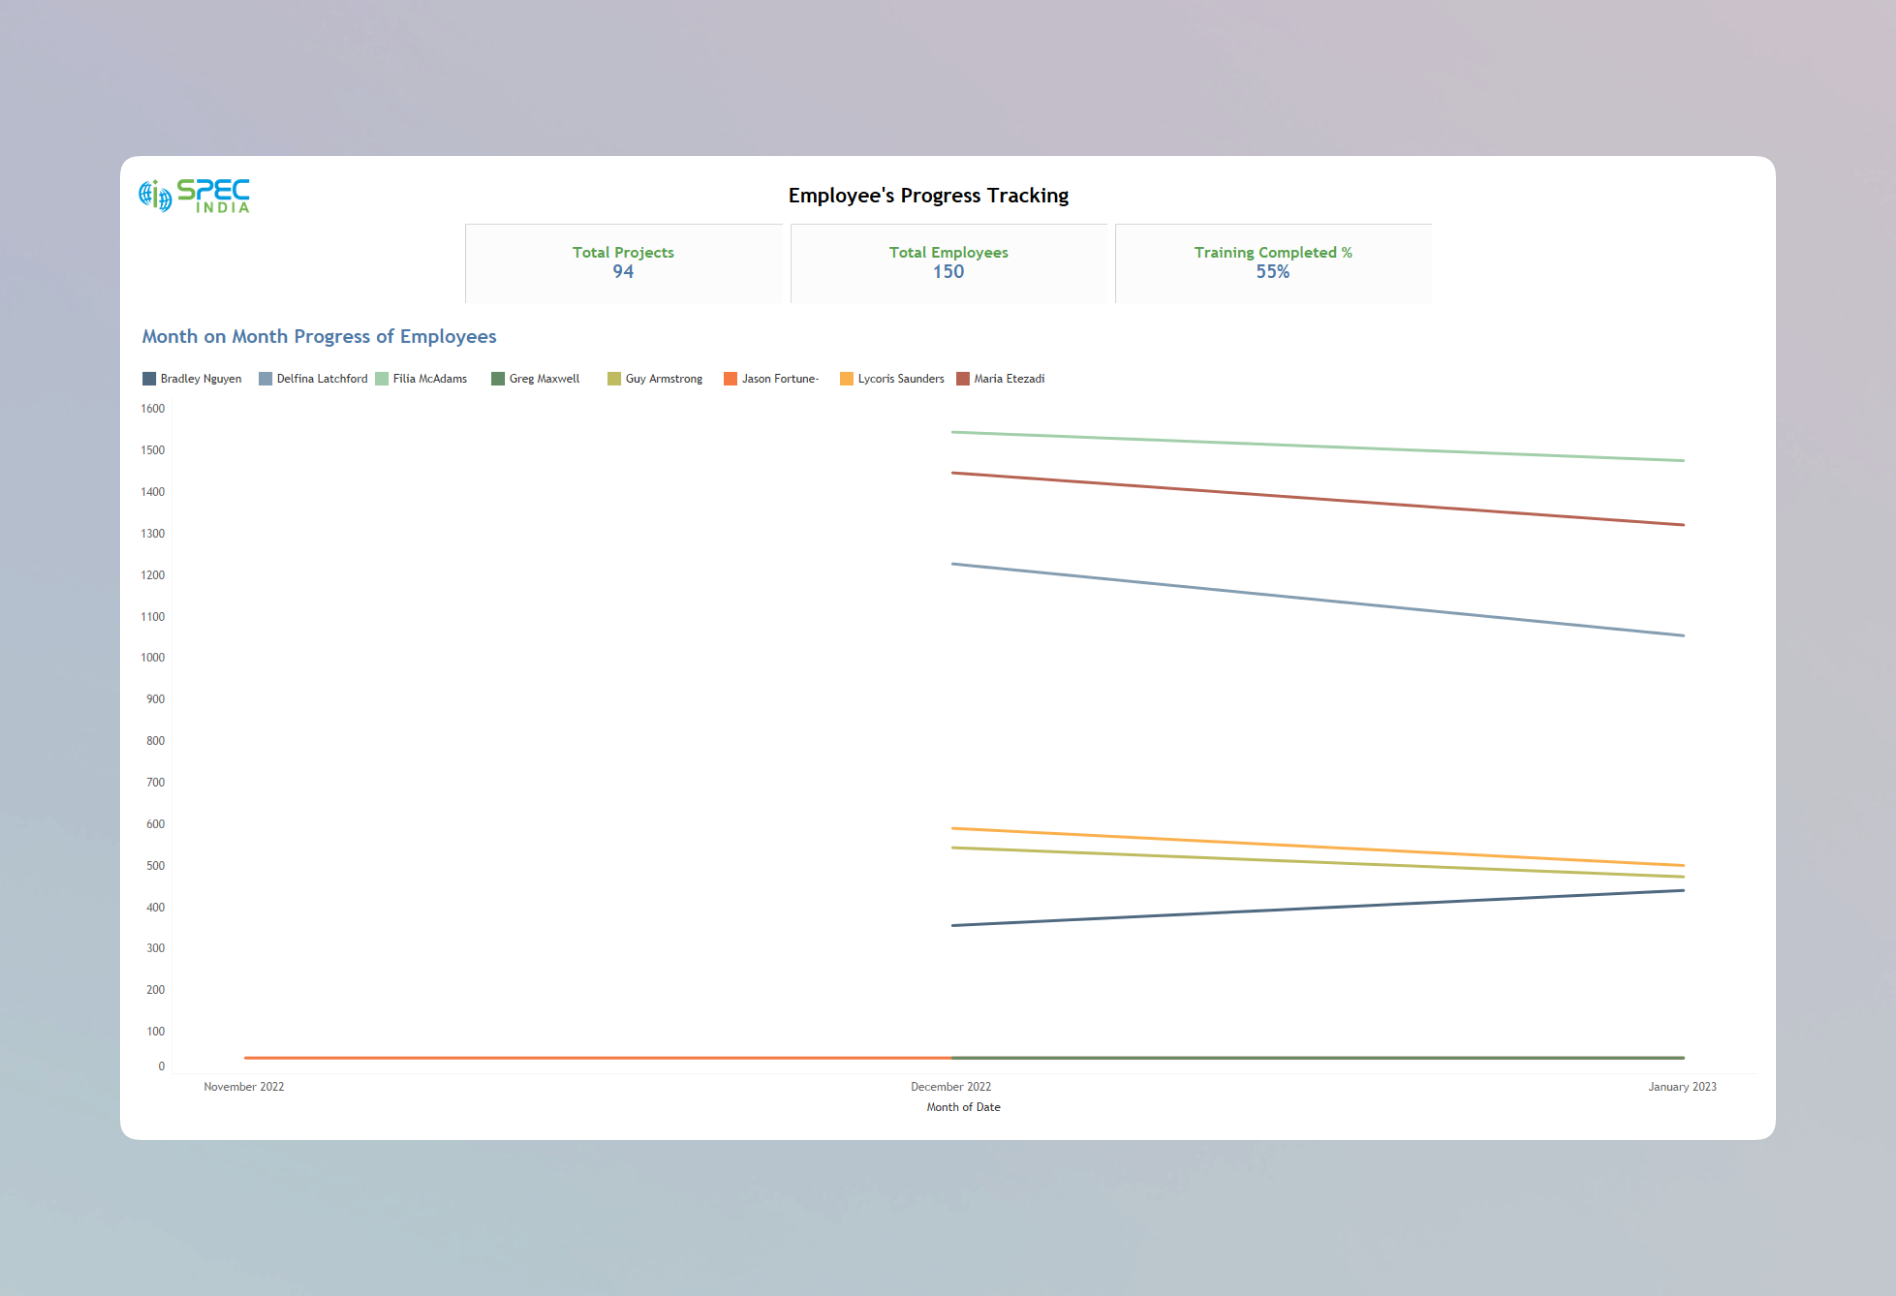
Employee Productivity & Progress Tracking
Program Sustainability Monitoring
Third-Party Application Integration
Results
-
01.
Employee involvement in different programs
Track and manage employee participation across various organizational initiatives. Gain insights into engagement levels and identify areas for increased involvement.
-
02.
Easy tracking of employee productivity
Monitor individual and team productivity with real-time metrics and performance data. Simplify valuation processes and support data-driven decision-making.
-
03.
Derivation of sustainable and non-sustainable programs
Analyze employee data to classify programs as sustainable or non-sustainable. Focus resources on impactful initiatives and discontinue low-performing ones.
-
04.
Estimated completion based on MoM progress of employees
Forecast project or program completion timelines using month-over-month employee progress. Ensure better planning and timely execution with data-backed estimates.
Let’s get in touch!
India
SPEC House, Parth Complex, Near Swastik Cross Roads, Navarangpura, Ahmedabad 380009, INDIA.
-
 +91-79-26404031, 32-33-34
 -
 [email protected]
