


Tableau Custom Dashboard and Analytics Portal for Dispatch Management Firm

Client’s Business Goals
They were keen to design and develop a business intelligence solution with custom dashboards and reports for monitoring different parameters like revenue, billing clients, expense analysis, etc. that can help them take accurate business decisions.
Business Challenges
The client was finding it difficult to come up with a set of reports and dashboards that were created from multiple data sources. It was difficult to offer navigations based on current users with proper restrictions for first-time users. They had manual data in Excel sheets that was to be replicated and automated in Tableau.
Our Approach
Looking at the challenges faced by the client, SPEC INDIA followed the standard model of development that includes research and analysis, development, design, testing and deployment to develop the product. We designed and launched the BI reports and dashboards, after identifying and researching on various modern methodologies.
Technical Solution
SPEC INDIA understood the requirements and recognized the challenges faced by the client. We offered an end-to-end business intelligence solution with the best of Tableau visualizations to attend to different activities. We implemented logic to show navigations based on current users only for maintaining data privacy. We used Tableau functionality called data blending to connect & combine data from multiple data sources. We implemented custom logic using Table Calculations of Tableau to achieve the visualization desired by the client.
Key Inclusions
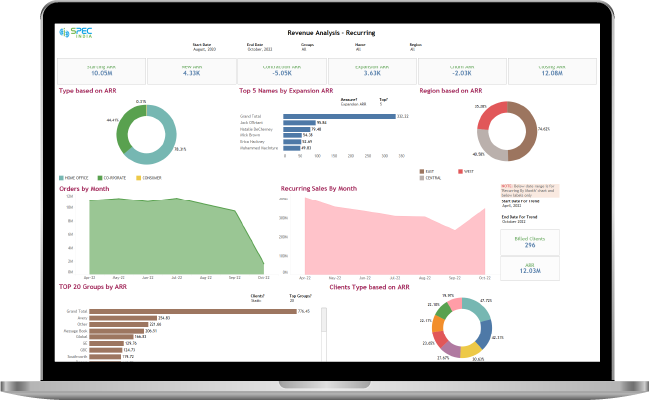
Revenue, expense, and client analysis and monitoring
Sale amount through Cohort analysis, quarter-wise, year wise
Monthly comparison of total amount based on groups, subgroups
Monitoring billing of clients
Target Vs Actual achieved
Expense analysis
Data privacy and security
Table Calculations for custom logic
Budget Vs YTD, category-wise, type wise
Performance Marketing ROI
MoM Breakup
Pipeline report analysis
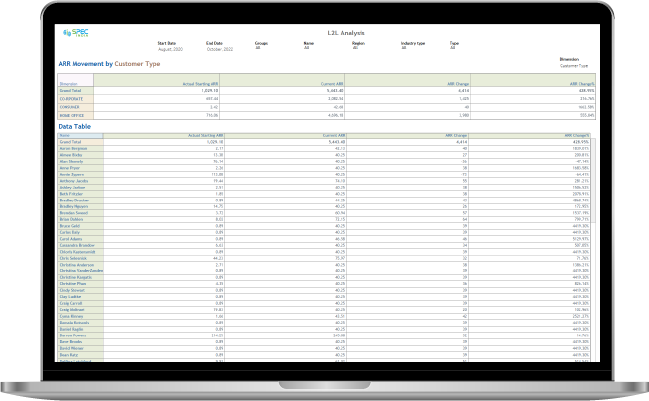
Tech 10x4 analysis
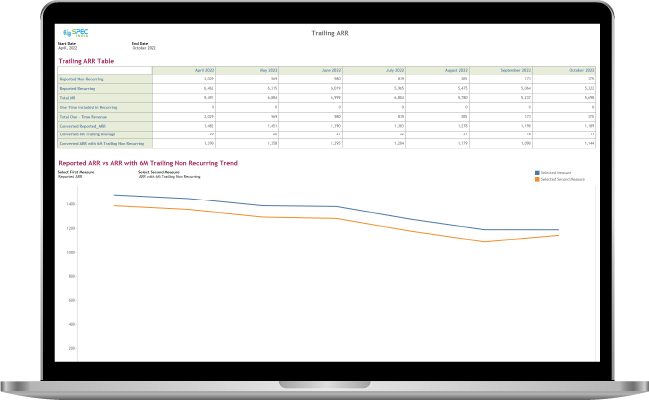
Trailing ARR
Screens

Do You Want To Make Data-Driven Decisions For Your Project?
We have helped a number of global clientele with our analysis and reporting services to drive better performance based on data
Technologies & Tools
Our Process
Research/Analysis
Our detailed and accurate research, analysis, and refinement leads to a comprehensive study that describes the requirements, functions, and roles in a transparent manner.
Design
We have a team of creative design experts who are apt at producing sleek designs of the system components with modernized layouts.
Coding
Our programmers are well versed with latest programming languages, tools, and techniques to effectively interpret the analysis and design into code.

Testing
Quality is at the helm of our projects. We leave no stone unturned in ensuring superior excellence and assurance in all our solutions and services.
Launch
We have well-defined, robust, and secure launch criteria that offer us a successful implementation clubbed with detailed testing, customer acceptance, and satisfaction.
Business Benefits of Tableau Custom Dashboard
Easy monthly monitoring of revenue, expense, and clients
Expense distribution can be managed, calculated, and monitored effortlessly
Check the sale amount and number of billing clients using Cohort analysis
Determine how much business has been achieved so far as compared to the decided targets
Monitor how many opportunities are been lost, won or are in pipeline
Optimal performance of dashboards with complex visualization
User-specific, effective, and well-optimized visualization and dashboards
Enriched graphical user interface (GUI)
Let’s get in touch!
India
SPEC House, Parth Complex, Near Swastik Cross Roads, Navarangpura, Ahmedabad 380009, INDIA.
-
 +91-79-26404031, 32-33-34
 -
 [email protected]
