


UK
Power BI, OneDrive, MySQL, Google Analytics
Finance
The project is about developing a Power BI-based software application for a leading financial firm that offers clients the critical financial tools needed to enhance lives and create a financially inclusive world with economic access to all. It works to empower clients, businesses, and communities that are overlooked by the global financial system, by funding and growing companies to meet their financial needs.
They have a global initiative in terms of a financial and digital portal that uplifts lives by boosting business. It offers innovative solutions for microentrepreneurs to help them build their management, financial and digital capacities by incentivizing actual behavior change, to thrive in a competitive and digital world.
They were keen to design and develop a business intelligence solution that can act as a support to their learning management system, and gather insights from their digital portal for course and module-related activities. They wanted detailed analysis from Google Analytics data, KACE system data and other data chunks for further detailing. They needed the status of support tickets and other KPIs.
The client was finding it difficult to visualize different reports based on parameters. They were looking for a business intelligence application that could gather information from different sources, get map data from Google Analytics and upload it to the reports, and complex chart-type formatting for creating user-defined reports.
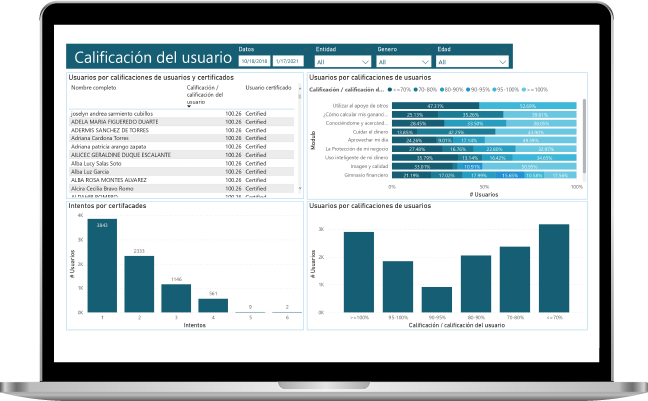
We have designed a range of Power BI dashboards and reports to offer insights for different categories like course completion, course and module-wise activities, enrolments, certification, badges, and other activities as listed below. These reports and dashboard act as foundation support for their learning management system.
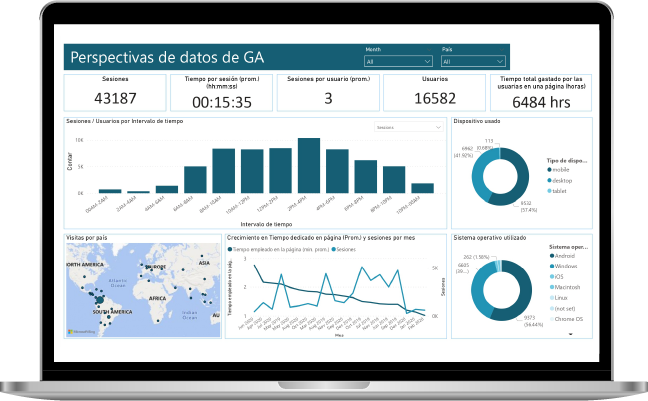
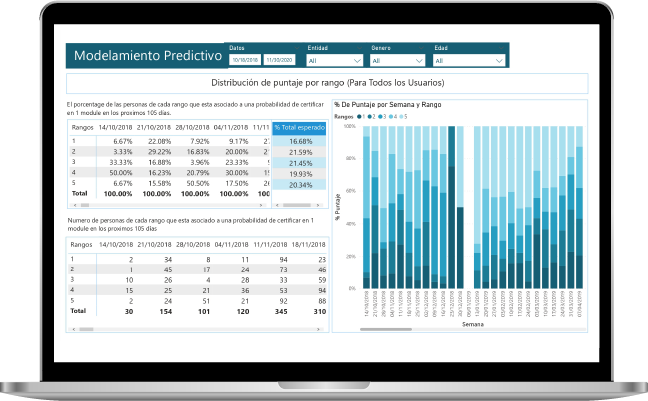
We have also designed insights for the ticket management system that extracts data from data sources like Google Analytics, KACE, and Vimeo Analytics for video views, geographical user insights, and Predictive Modeling.
There have been requirements for complex chart type, in which we have used tweaks for transparency and formatted options of Power BI for generating complex visuals.
Predictive Modelling
Distribution of Score
Population vs Average Score
Trends per Range
Expected Tables for Week
Badge
Number of badges achieved by level of education
Average no of badges achieved per user
Badge achieved by age group and gender wise
Number of badges achieved by level of sales
Tools
Number of tools downloaded by Level of Sales
Number of tools downloaded by Level of Sales
Number of tools downloaded by tool name
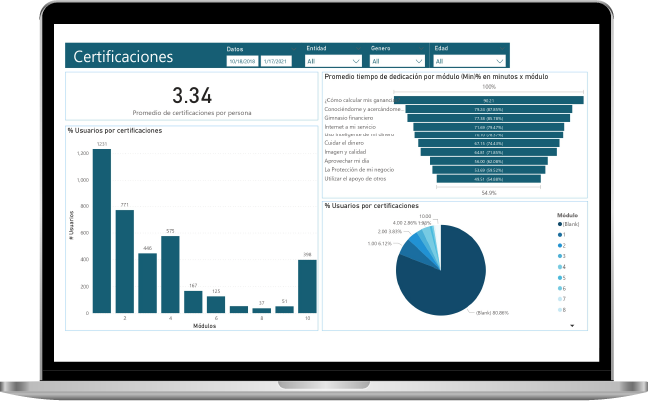
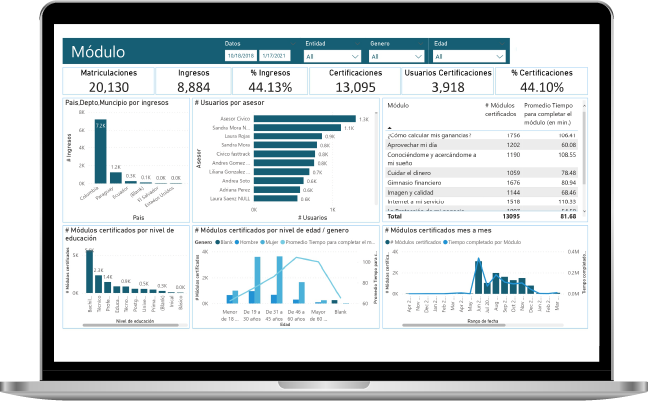
Module
Total Number of Certified Modules, most/least certified,
Number of users promotor wise
Module wise number of certified users, logins and average time in minutes for completions of that module
Completed module by each level of education, by age and gender, date range, month etc.
No of Users by Module Completion
Total percentage of no of completed modules
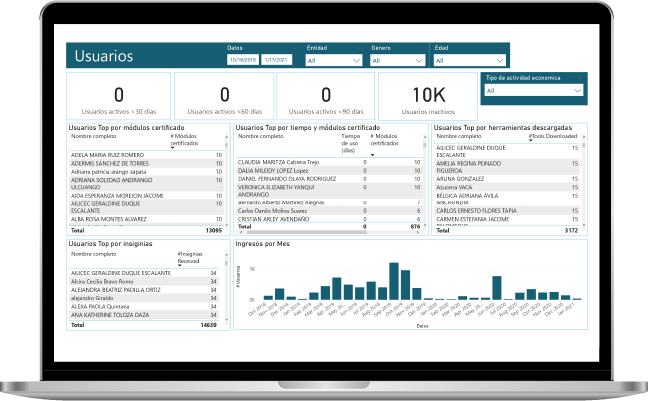
User Details
Users by gender, hierarchy, age, education, sales, status etc.
Top 10 Users by Completed Modules
Top 10 Users by Min Time and Max Time Certified Modules
Top 10 Users by Tools Downloaded
Top 10 Users by Insignias Received
Active Users vs Days
Filter Selection
Filtration of data based on date range, gender, age, education, sales
Filtration of data based on country, state, city hierarchical filter, module
Assessor
Users per field staff
Registrations, Logins, Certifications by Assessor

Our solution enabled the business to achieve the following benefits:
Easy tracking of the entire learning management system, ticket management, marketing insights etc.
Predictive modeling for duration of course completion and status of users
Overall impact of product / service on financial and business wellbeing
Insights in an interactive manner
Faster decision making on product impact
Increased digitization inputs
Viewing dashboards on an ongoing basis
Futuristic view of business information
Dynamic representation and interaction with data
Business growth and job creation
SPEC House, Parth Complex, Near Swastik Cross Roads, Navarangpura, Ahmedabad 380009, INDIA.

This website uses cookies to ensure you get the best experience on our website. Read Spec India’s Privacy Policy