

Marketing Business Analytics Solution for Financial Firm
They were keen to design and develop a one-stop marketing business intelligence solution that can get meaningful insights by tracking the user traffic to the website, user response on the products placed on the website, campaign management with cost of campaigns per user and the best and worst campaigns on the social media platforms.
-
Industry
Industry Marketing and Finance -
Country
Nigeria
Technologies

Years In Business
Projects Delivered
Happy Clients
Countries Served
Business Goals
- Centralize Marketing KPIs
Consolidate key performance indicators across digital channels into unified, intuitive Power BI dashboards. - Enable Cross-Platform Analytics
Streamline data collection from Google Ads, Meta Ads, and LinkedIn Ads to analyze and optimize campaigns effectively. - Enhance User Behavior Insights
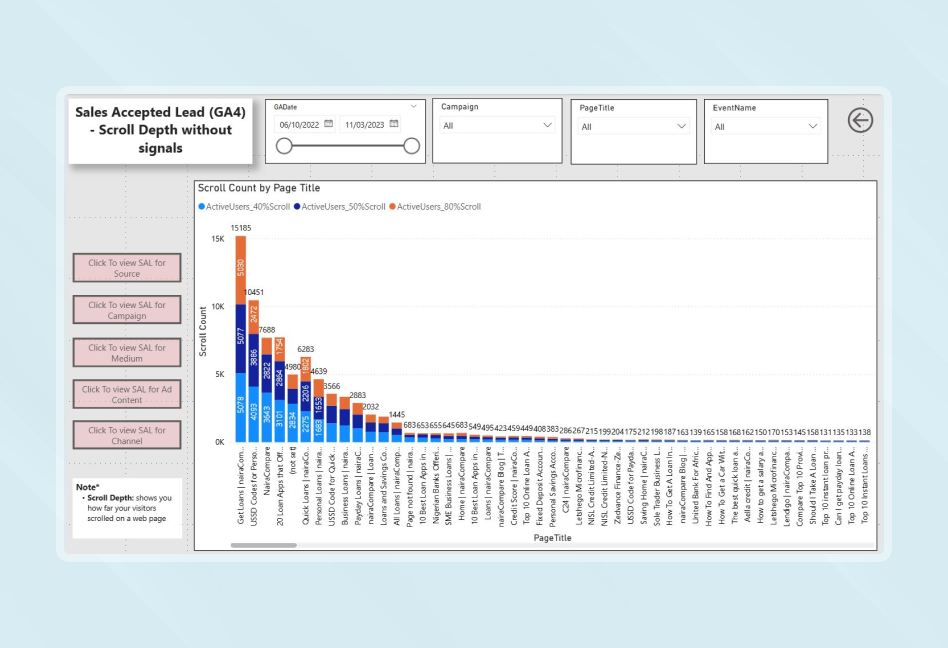
Monitor traffic trends, campaign engagement, and content performance (blogs, products) based on user demographics and location. - Improve Lead Tracking Accuracy
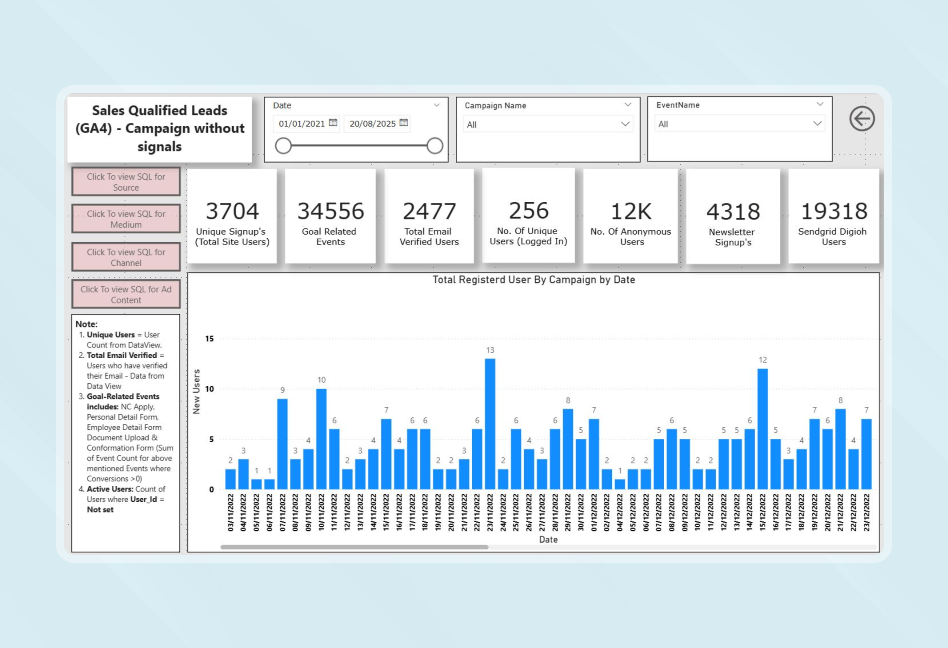
Track the full journey from Marketing Qualified Leads (MQLs) to Sales Accepted Leads (SALs) with precise attribution and analytics. - Ensure Data Reliability and Compatibility
Resolve mismatches and incompatibility issues between Google Analytics and Power BI to maintain data accuracy.
Business Challenges
Single View KPI Management
Difficulty managing all critical KPIs within a single Power BI report due to data complexity and volume.
Google Analytics Dimension Mismatch
Incompatibility and threshold limitations in GA dimensions led to inconsistencies in Power BI reporting.
API Authentication Complexity
Generating access tokens for Meta and LinkedIn marketing APIs was time-consuming and not user-friendly.
Data Volume & Performance Bottlenecks
Handling large volumes of campaign and user interaction data caused slow query performance and delayed report refreshes in Power BI, making real-time decision-making difficult.
Attribution Tracking Complexity
Accurately mapping user journeys from first interaction to lead conversion across multiple channels posed difficulties, resulting in attribution gaps and incomplete funnel visibility.
Technical Solution
-
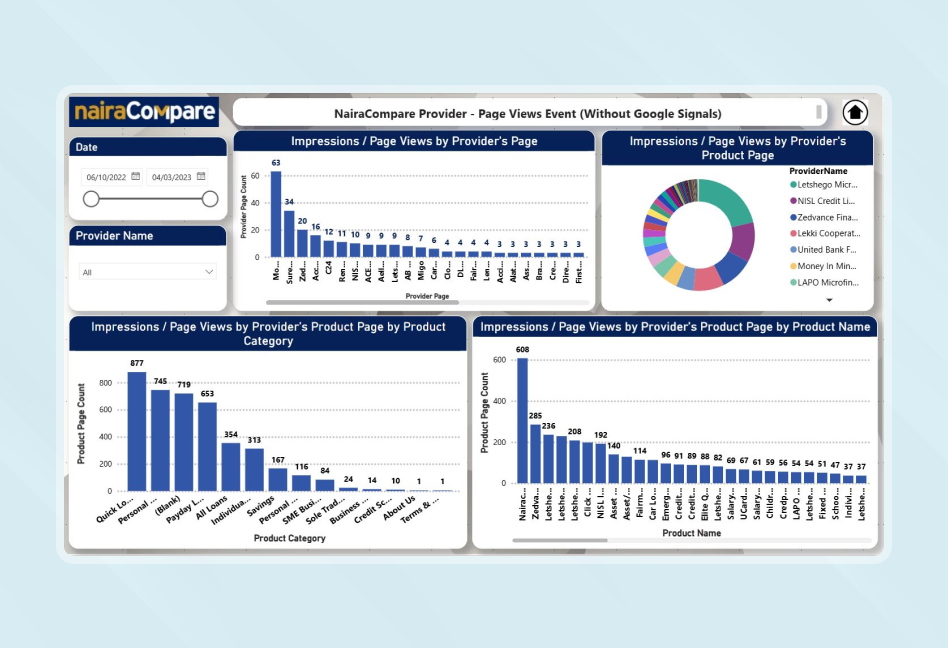
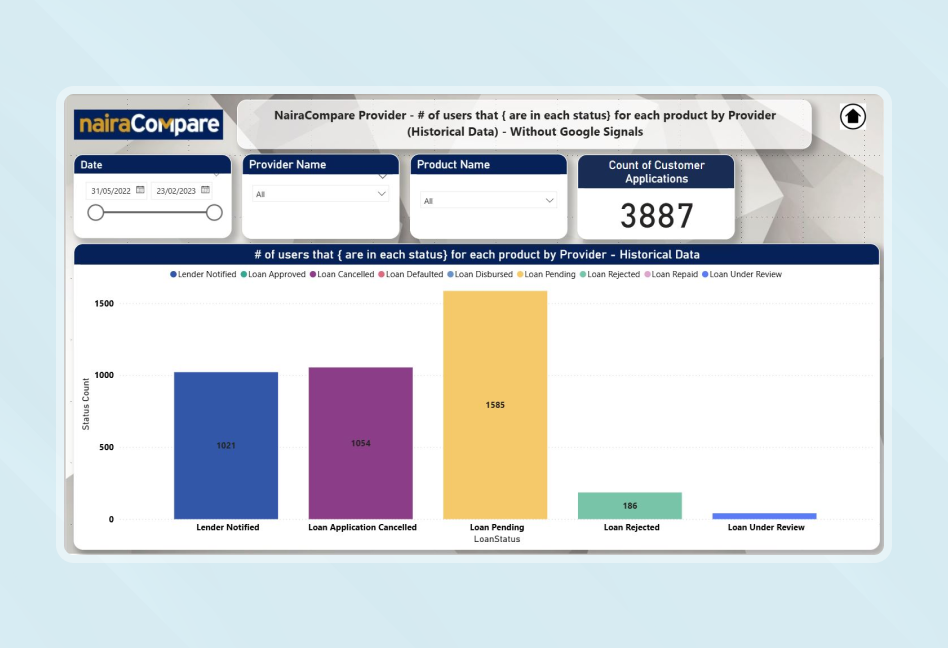
Custom Power BI Reports
Designed tailored Power BI dashboards that visualize key metrics such as campaign performance, user interests, and product interactions.
-
Google Ads Data Integration via Sheets Connector
Leveraged Google Sheets as a connector to pull Google Ads data into Power BI seamlessly.
-
Social Ads API Integration
Fetched Meta and LinkedIn ad data directly through their marketing APIs for real-time campaign tracking.
-
Azure SQL-Based Production Data View
Integrated data views from production Azure SQL Server to ensure reliable, centralized access.
-
Advanced ETL Pipeline Development
Built ETL workflows for marketing analytics including tracking of MQLs and SALs, ensuring clean and structured data flow.
-
Row-Level Security Implementation
Incorporated row-level security in Power BI to ensure data access control based on user roles and regions.
Project Glimpse
Key Features
Unified Power BI Dashboard
Cross-Platform Marketing Analytics
Dynamic Campaign Performance Reports
User Interest & Behavior Analysis
Marketing & Sales Funnel Tracking
Custom ETL Pipelines
Results Achieved
-
01.
Improved Campaign Performance
Enabled data-driven decisions to identify and improve the lowest-performing campaigns, resulting in better website traffic.
-
02.
Optimized Marketing Spend
Facilitated effective budget allocation across Google, Meta, and LinkedIn campaigns based on real-time performance metrics.
-
03.
Expanded Product Reach
Identified user interests and content preferences, helping the client increase product visibility and relevance across segments.
-
04.
Enhanced Data Interpretation
Delivered simplified and actionable insights through intuitive visualizations such as charts, tables, and filters in Power BI.
-
05.
Validated Decision Support
Provided reliable, cross-platform data to support strategic marketing and sales decisions with confidence.
Let’s get in touch!
India
SPEC House, Parth Complex, Near Swastik Cross Roads, Navarangpura, Ahmedabad 380009, INDIA.
-
 +91-79-26404031, 32-33-34
 -
 [email protected]
