

USA
PDI, R, Shiny, K-Mean Algorithm
Retail & Manufacturing

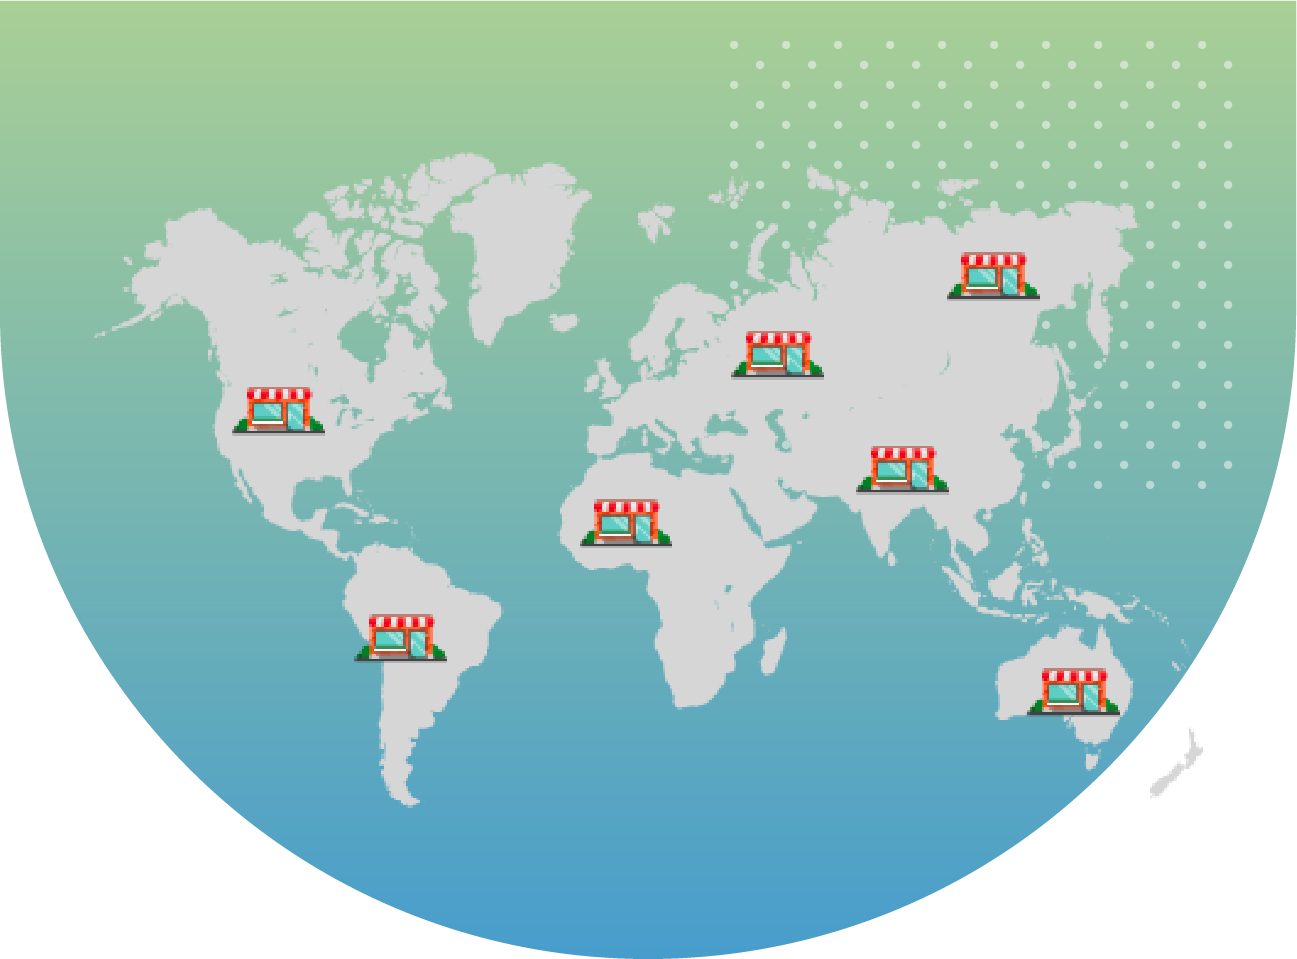
As the company has thousands of stores across the globe, the company wanted to create store clustering based on the category, country and average sales per square foot. They wanted to divide stores into 12 to 15 different groups so that they can build the same marketing strategy.
Need to consolidate the last 3 year’s retailer’s data sources (format like MySQL, CSV, etc) of sales transactions into a single form of data.
As there was a large number of product sets, it was difficult to derive the common category of the products.
Wanted to enable more localization of seasonal products
After analyzing the challenges and requirements of the client, SPEC INDIA designed a solution for store clustering that can help to give an edge to the business.
1852 stores divided into 12 large clusters based on the category, country as well as sales of each category
Developed ETL jobs to transfer the different forms of the data into the MySQL database
Developed data models and transformed the data from staging to data marts
Derived Additional Variables
Explored data sets by generating the descriptive statistics
Scaled and Weight the variables based on business team inputs
Perform the K-Mean Clustering for 10 to 20 clusters groups
Profiled the cluster and derived the observations for each cluster

Unleash the Potential of Business Intelligence with our BI Developers Showcasing Technically Superior Skills


Our detailed and accurate research , analysis, and refinement leads to a comprehensive study that describes the requirements, functions, and roles in a transparent manner.
We have a team of creative design experts who are apt at producing sleek designs of the system components with modernized layouts.
Our programmers are well versed with latest programming languages, tools, and techniques to effectively interpret the analysis and design into code.

Quality is at the helm of our projects. We leave no stone unturned in ensuring superior excellence and assurance in all our solutions and services.
We have a well-defined, robust, and secure launch criteria that offers us a successful implementation clubbed with detailed testing, customer acceptance and satisfaction.
By applying the solution following benefits/business details has been derived which helps the client’s business in many ways
12 Outliers stores detected having less space, but their sales went higher than the average sales.
17% of the stores have higher than average sales.
30% of the stores have significantly higher tobacco and alcohol sales
12 marketing strategies were defined based on the observations and deployed across all the 1852 stores.
Strategies were monitored for over 3 months and sales were increased by 7%.
Increased foot traffic also resulted in greater opportunities for impulse buying.
Speed and Efficiency was increased as retailers could create a localized assortment for multiple locations
SPEC House, Parth Complex, Near Swastik Cross Roads, Navarangpura, Ahmedabad 380009, INDIA.
This website uses cookies to ensure you get the best experience on our website. Read Spec India’s Privacy Policy