Go Green One tree
One life
Trees
Loading...

Data Analytics and BI Platform for Education Domain

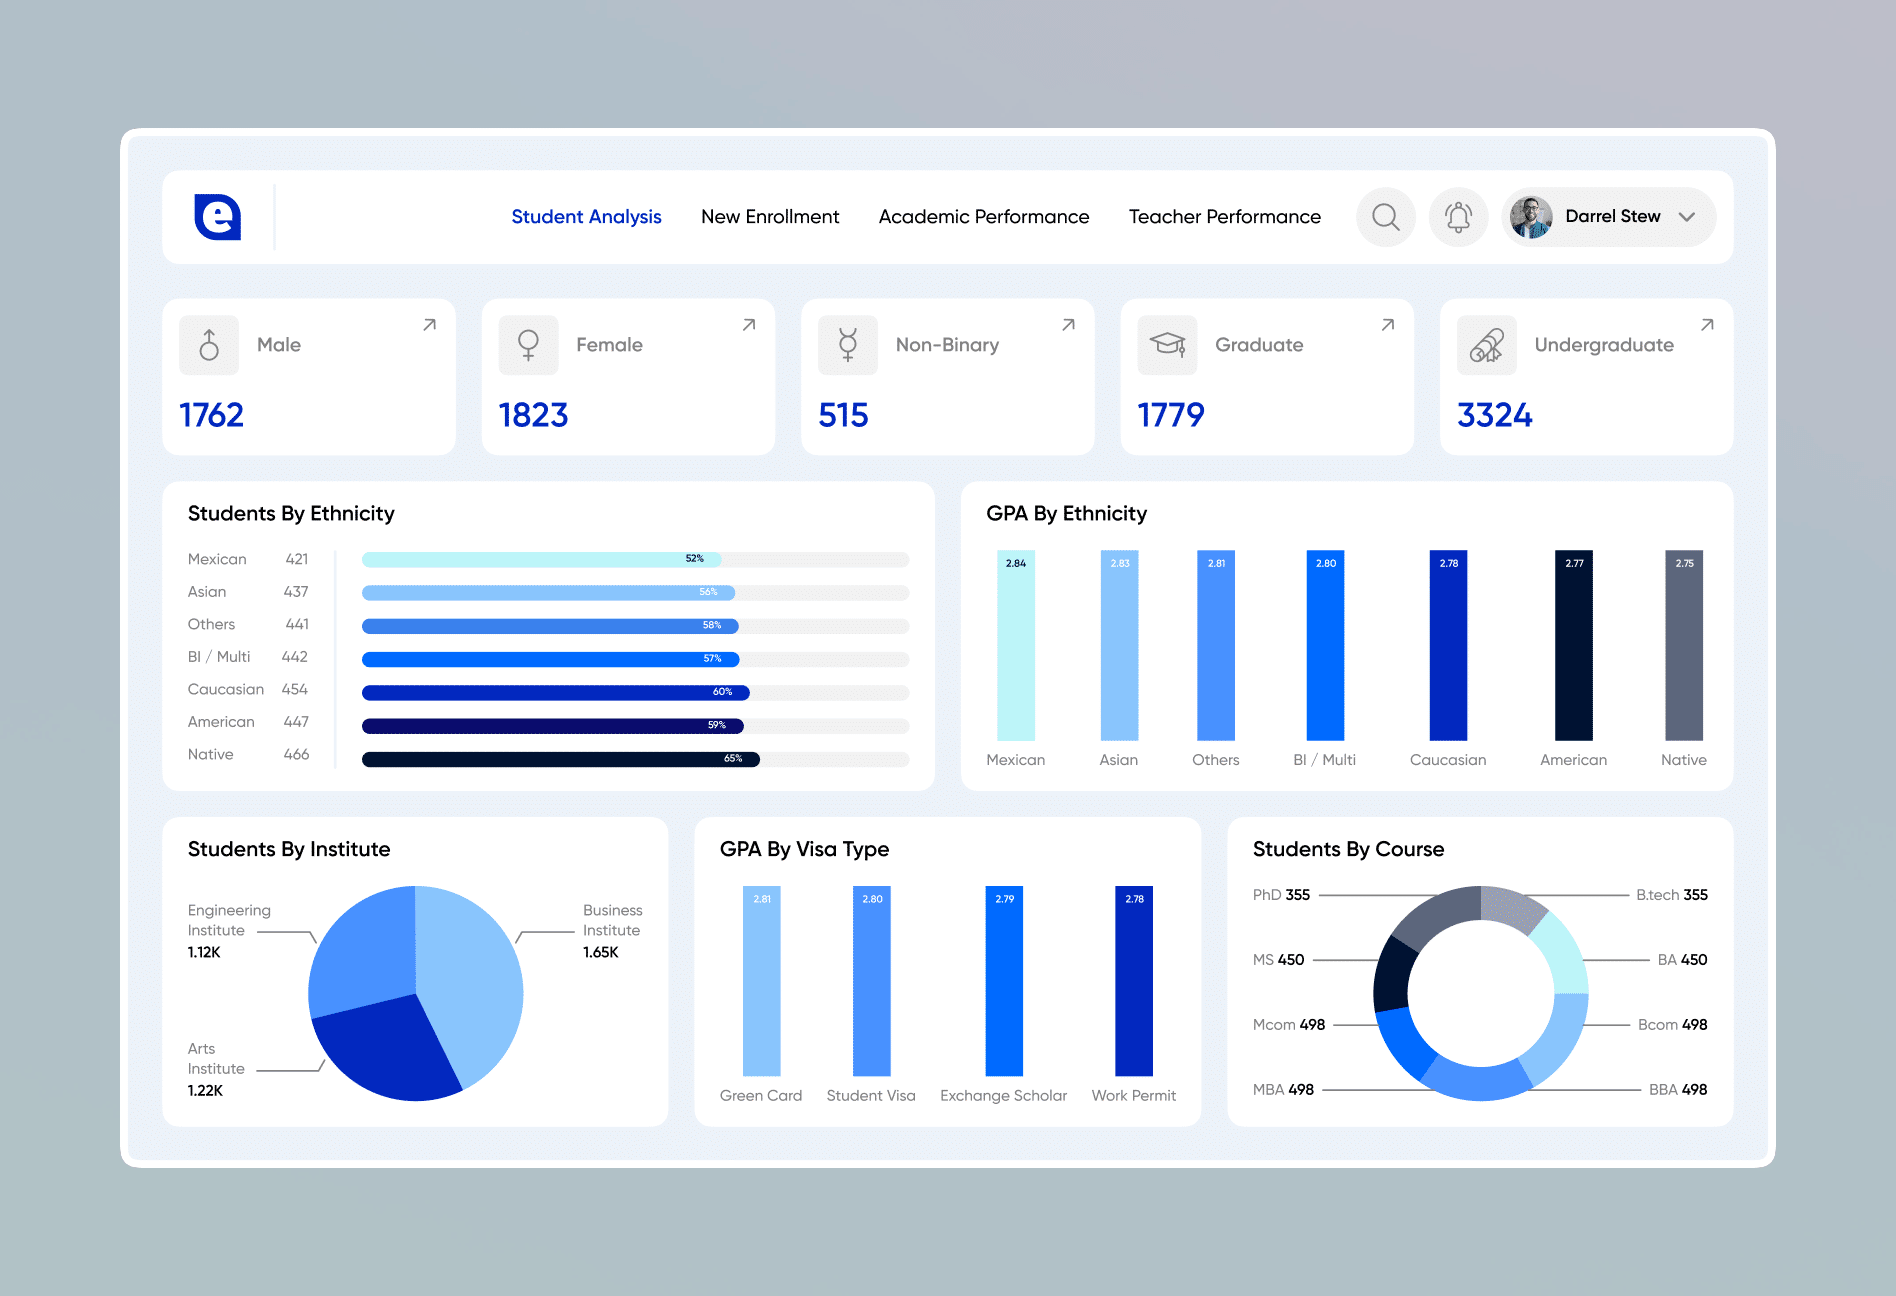
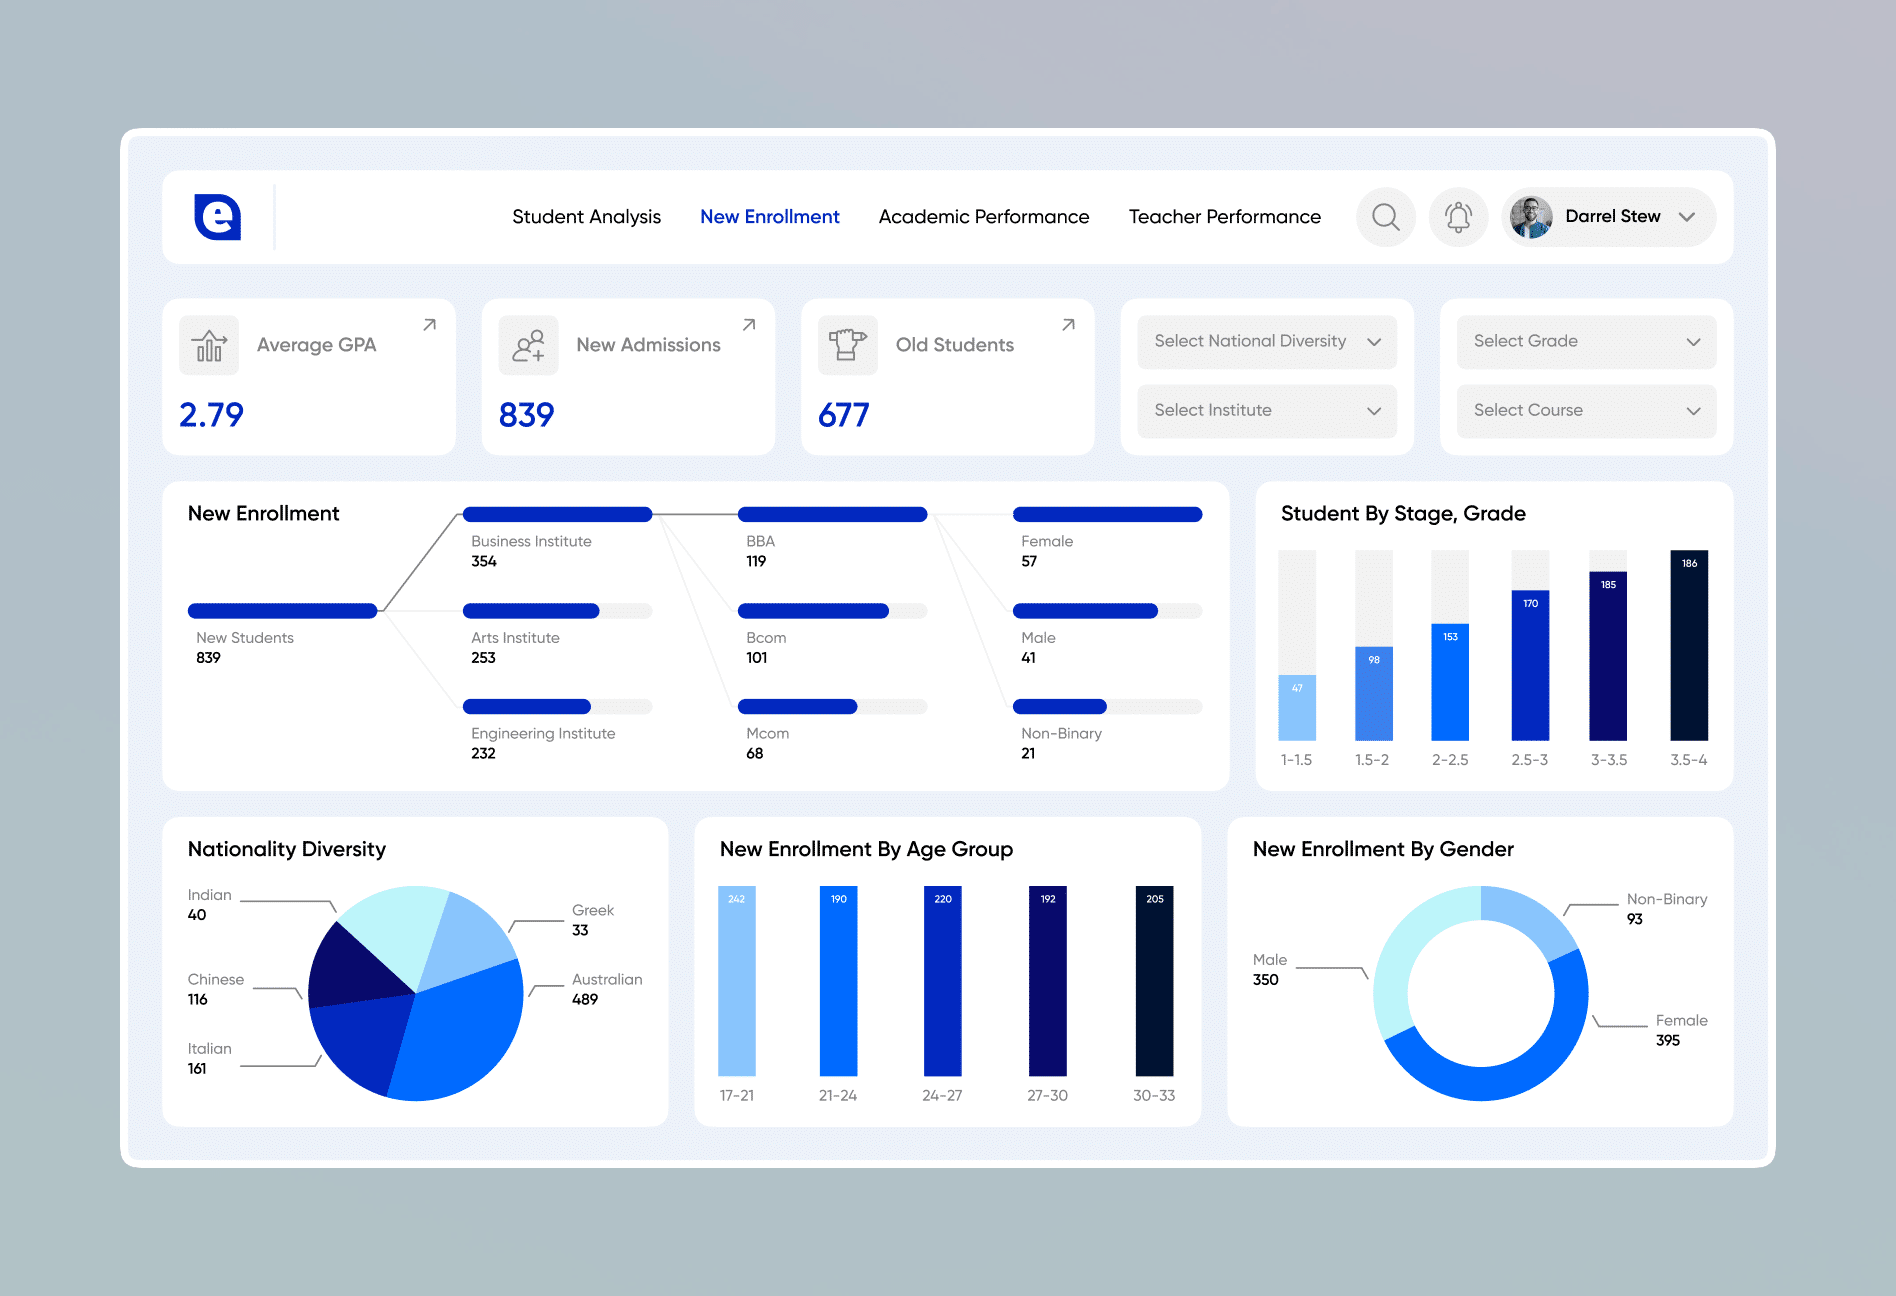
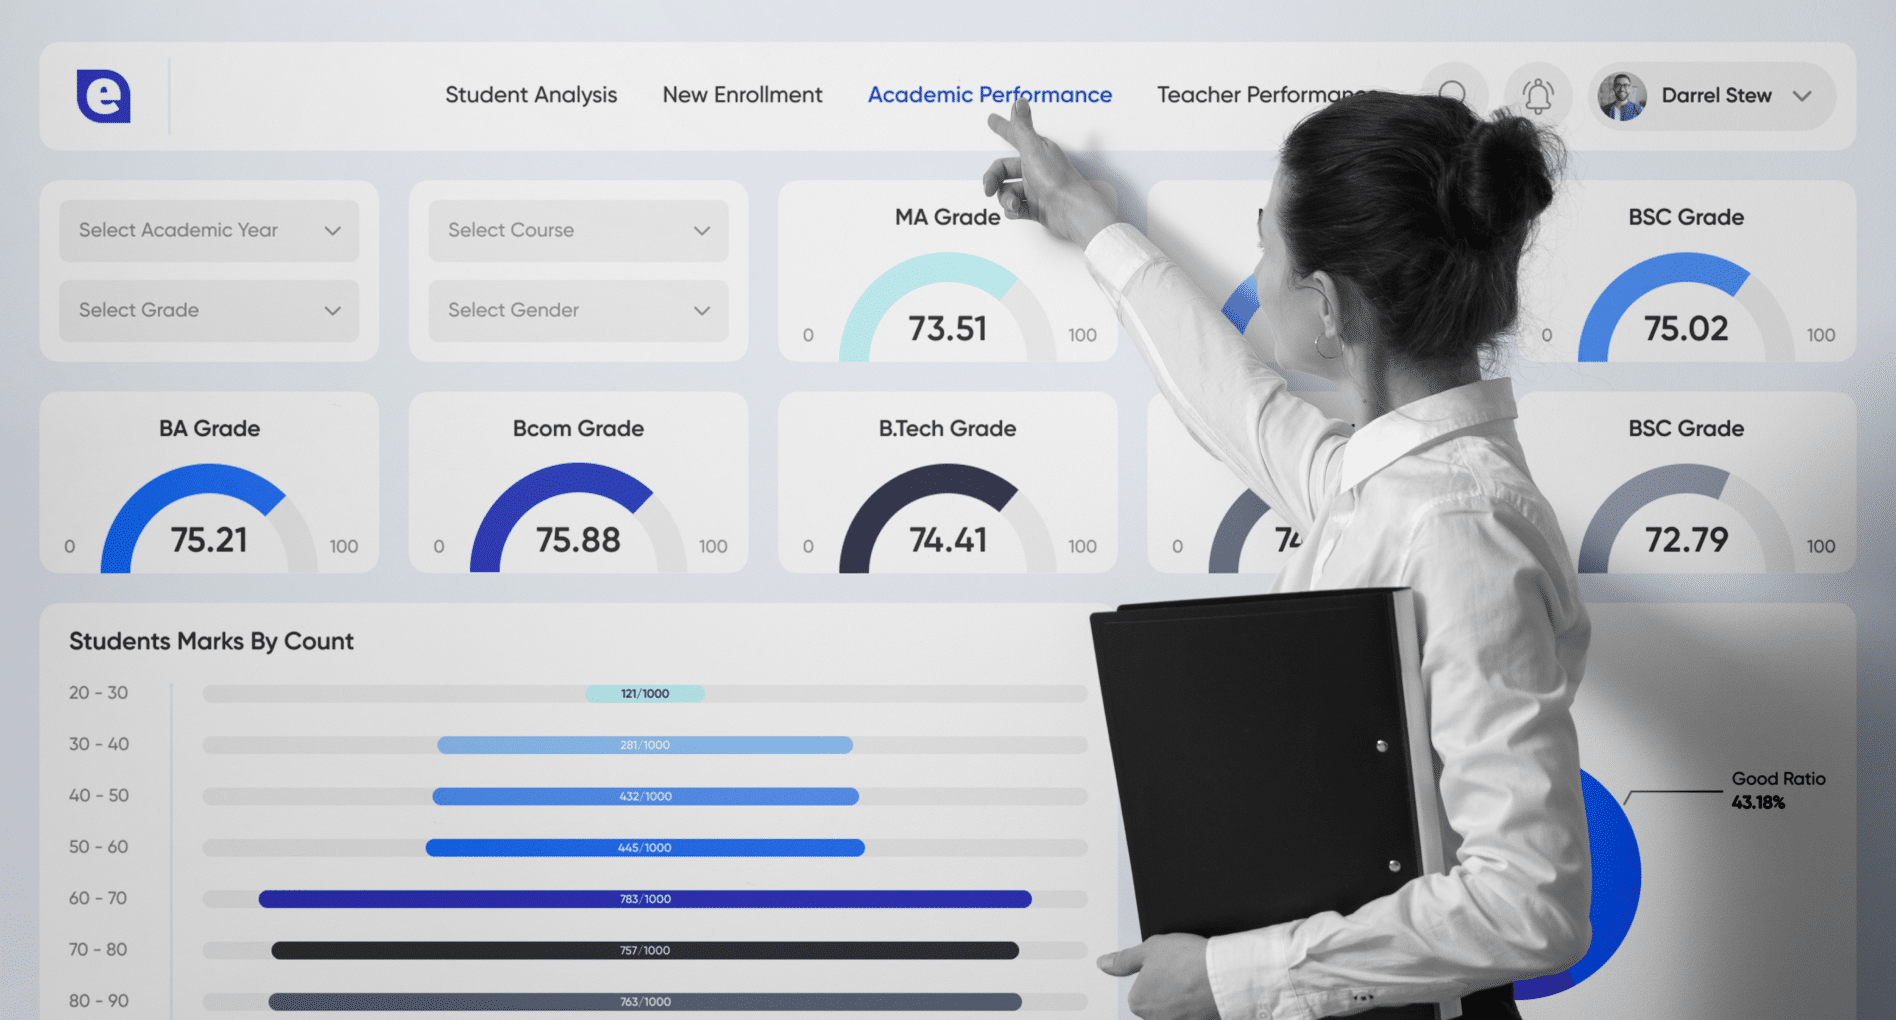
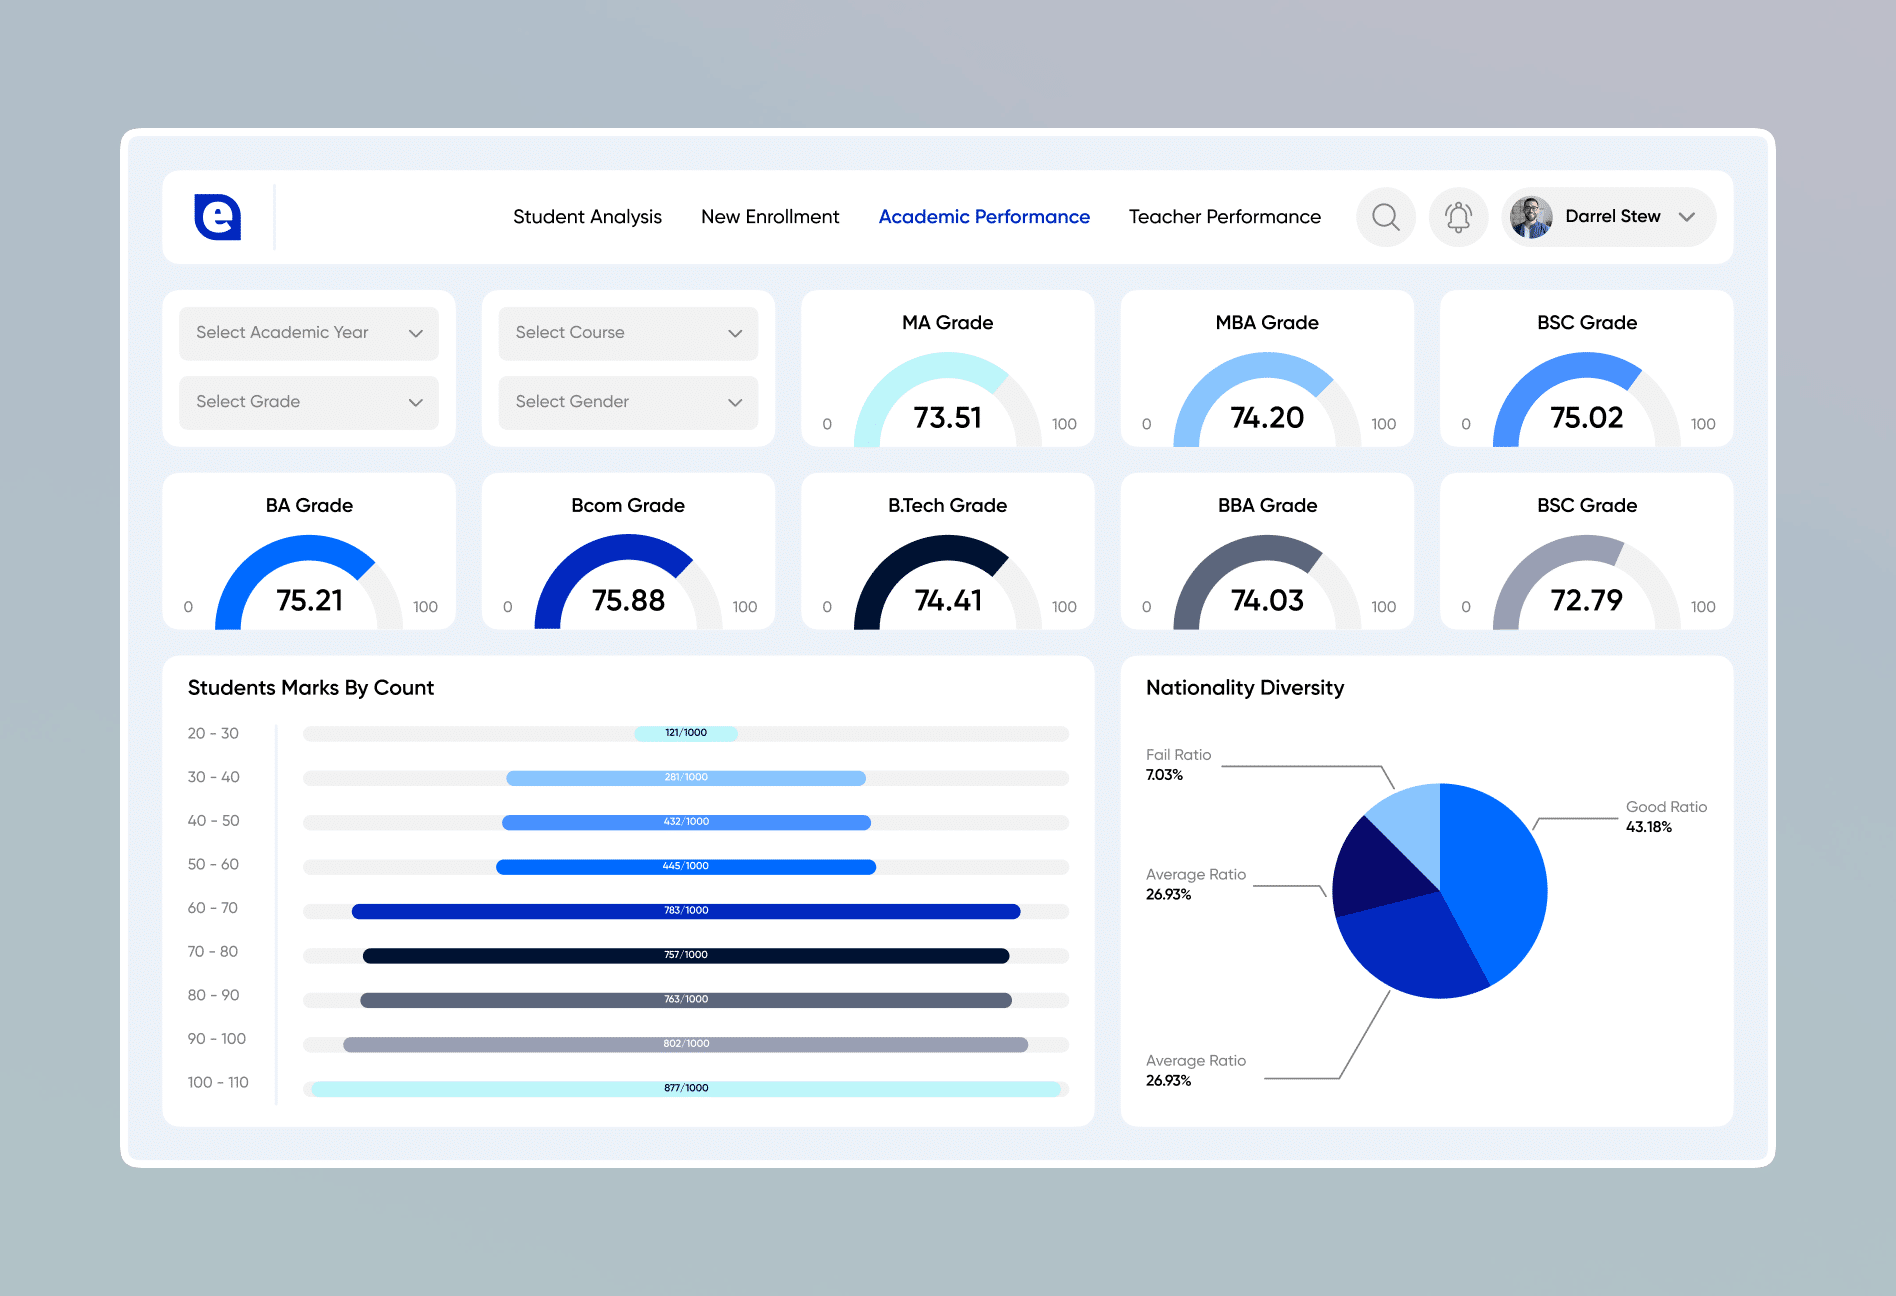
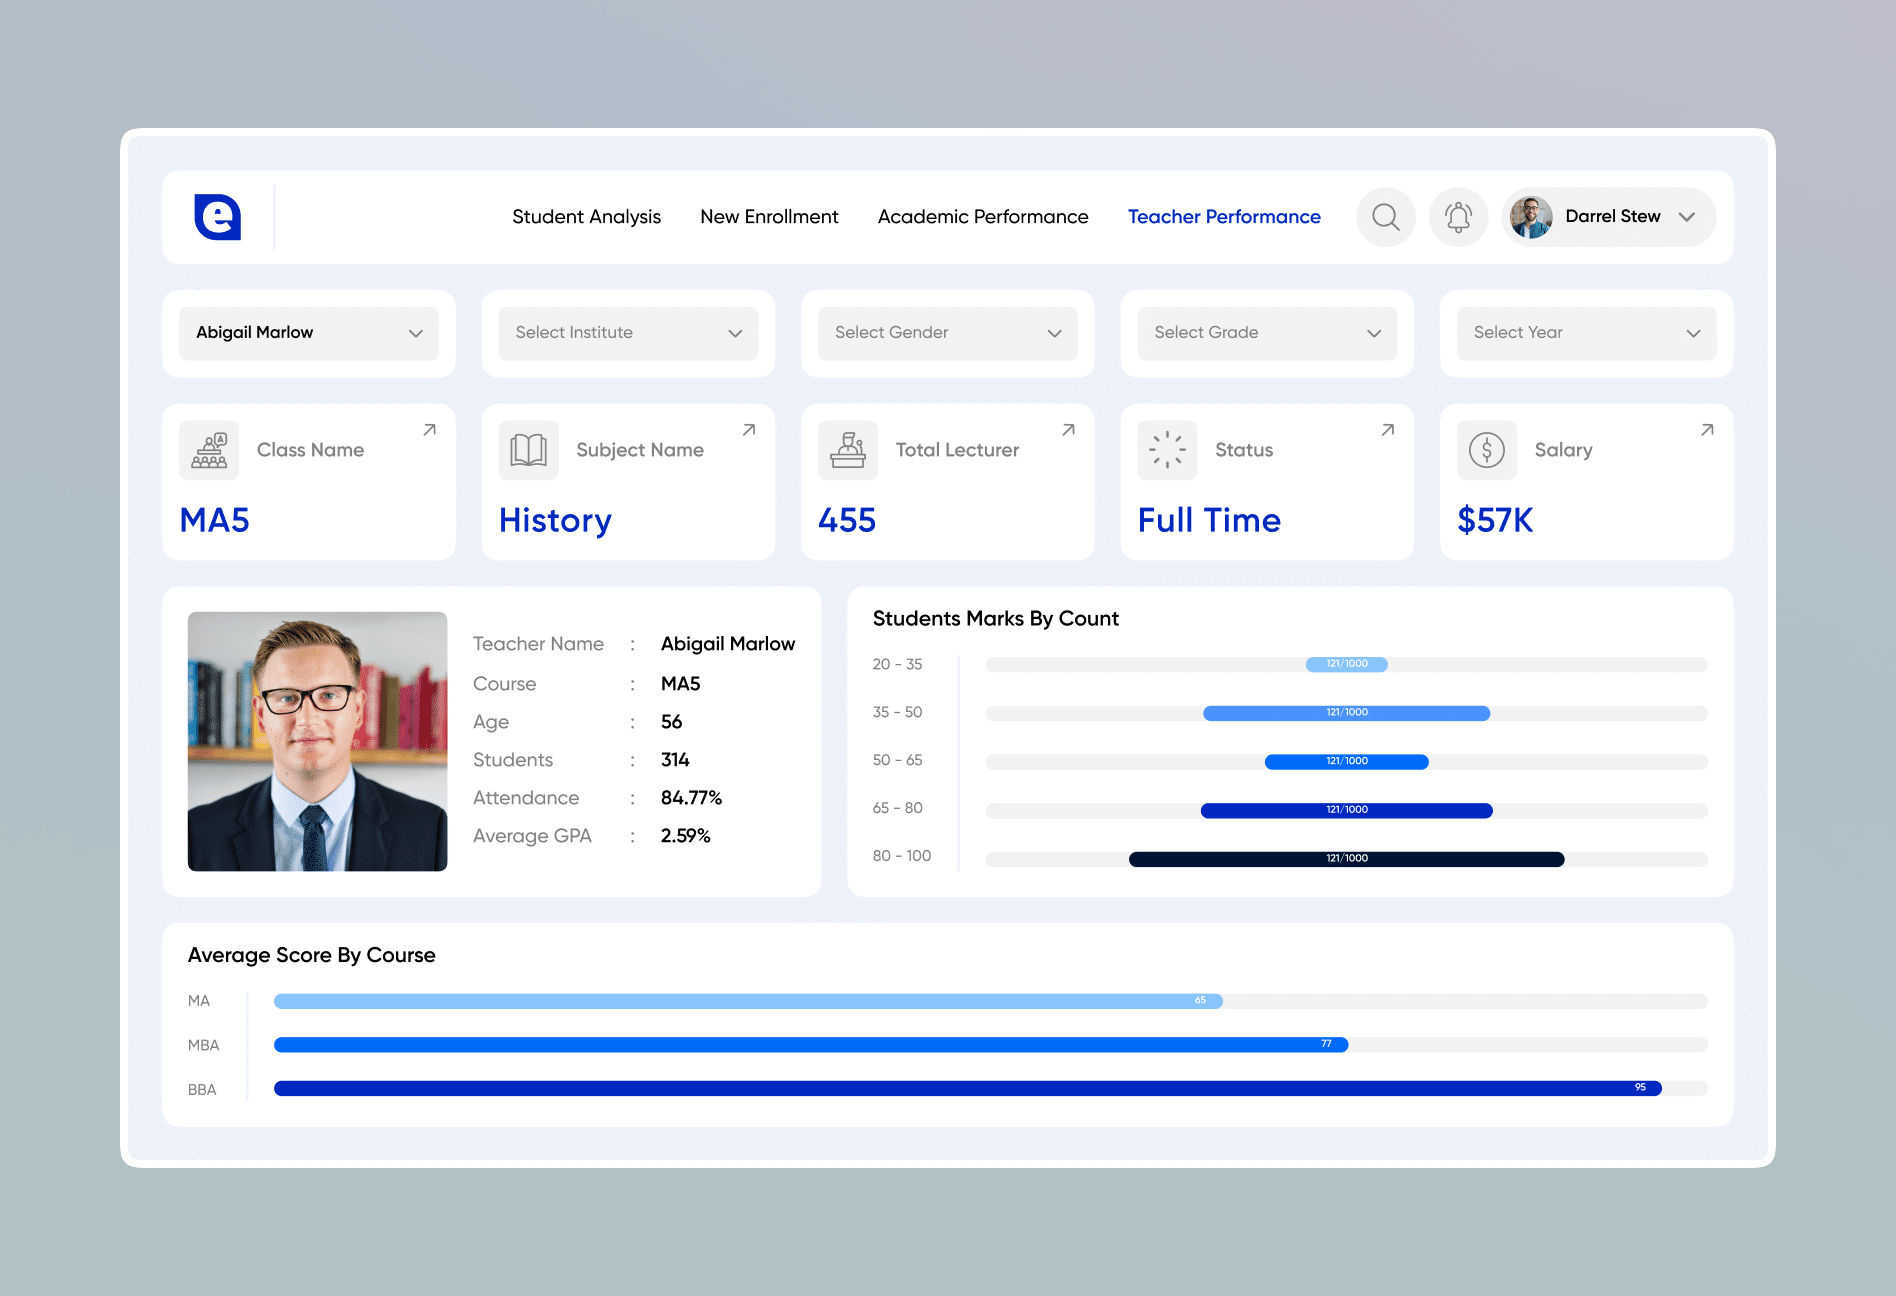
We were approached by a premier USA-based higher secondary school based in California. We build a solution that integrates data from various sources like KACE, Google Analytics, and Vimeo to track and upgrade faculty and student performance. Our Power BI dashboard helped them with actionable insights into course completion, interactivity levels, support metrics, and certification trends. Besides, the system empowers academic leadership and predictive analytics to identify learning gaps and drive continuous improvement in results.
  • Industry
    Education
  • Country
    USA
Technologies
Business Intelligence Platform Creation for USA-based High School
Years In Business
36+
Years In Business
Projects Delivered
3000+
Projects Delivered
Happy Clients
200+
Happy Clients
Countries Served
40+
Countries Served

Client Goals & Expectations

  • Improve student and faculty performance by evaluating engagement, course completion, and data assessment trends.
  • Enable data-driven decisions through interactive Power BI dashboards offering real-time KPI visibility.
  • Centrale reporting by consolidating data from varied sources into a unified BI platform.
  • Upgrade user engagement and learning outcomes by monitoring certifications, badge achievements, and video usage.

Challenges Faced by Client

Lack of Centralized Reporting

Lack of Centralized Reporting

There were data across platforms that weren’t structured due to which it was difficult to obtain a unified view.

Limited Visibility into Performance Metrics

Limited Visibility into Performance Metrics

The client struggled to track and measure student and faculty performance effectively in real time.

Manual and Time-Consuming Data Analysis

Manual and Time-Consuming Data Analysis

Since there was no technology or software involved, clients faced a lot of time consumption in generating reports and insights. It resulted in productivity reduction and decision-making efficiency.

Difficulty in Identifying Learning Gaps

Difficulty in Identifying Learning Gaps

There was no efficient system to detect weak areas in course delivery or student engagement for timely intervention.

Inability to Predict Performance Trends

Inability to Predict Performance Trends

Since there were no predictive analytics, it became difficult to plan academic strategies or support at-risk students.

  • Unified BI Platform Integration

    We helped them integrate data from multiple sources that have streamlined reporting and analysis.

  • Interactive Power BI Dashboard

    We developed real-time and engaging dashboards to monitor KPIs like course completion, user engagement, tool usage, and support metrics.

  • Automated Data Processing and Reporting

    We automated data extraction, transformation, and report generation processes to eliminate manual efforts.

  • Performance & Learning Gap Analysis

    Our dashboard learning and performance gap analysis features identifies trends, gaps, and areas that require improvement.
How we Confronted the Challenges

Project Glimpse

Core Features

Faculty performance analysis
Faculty Performance Analysis
High School Exam Analysis
Student Goal Setting
School Performance Comparison
Course Catalog Evaluation
Enrollment Data Reporting
Database design restructuring
Database Design Restructuring
Data Migration to SQL
Jasper Reports Customization
Complex Sub-reporting

Workflow Journey

01
Research

Our thorough and precise investigation, analysis, and improvement result in an extensive study that transparently outlines the needs, roles, and functions.

02
Designing

Our team of talented designers is adept at creating contemporary layouts and streamlined designs for the system's components.

Design
03
Coding

To efficiently translate the research and design into code, our programmers are knowledgeable about the newest programming languages, tools, and methodologies.

Coding
04
Testing

We take every precaution to guarantee outstanding quality and confidence in all of our services and solutions.

Testing
05
Deploying

With thorough testing, client acceptance, and satisfaction, our launch requirements are clear, strong, and secure, ensuring a successful deployment.

Deployment

Results

  • 01.
    Reporting Time Reduction

    Automated dashboards and centralized data access significantly cut down manual reporting efforts.

  • 02.
    Real-Time Academic Insights

    Enabled faculty and administrators to track student performance, engagement, and learning gaps instantly.

  • 03.
    Improved Exam Preparation

    Predictive analytics helped set realistic goals and strategies, contributing to better preparedness and higher pass rates.

  • 04.
    Enhanced Decision-Making

    Data-driven visibility empowered academic leadership to take timely, informed actions to boost overall outcomes.

  • 05.
    Streamlined Operations

    Migrating from legacy systems to a unified MS SQL database improved system performance, scalability, and data accuracy.

  • 06.
    Greater User Engagement

    Personalized learning analytics, badge tracking, and progress reports boosted student motivation and interaction.

Data Analytics Dashboard for School

Let’s get in touch!