Go Green One tree
One life
Trees
Loading...

Challenges

This school had a massive data of students, faculty, admissions, exam grades, scholarship, financial aid, and other government submission reports. But, the data scattered in multiple systems and had tight integrations with various systems.

Following were the key challenges:

Consolidating data from multiple sources and designing data warehouse

Data profiling for accuracy & completeness

Data cleansing for detecting and correcting corrupt records

Embed various visualization and analysis in the web-based system for admission and management staff

Data Sources

Web-based system storing student-faculty online application and admission data

CRM integration with Salesforce

Financial Accounting data in Peach Tree

Legacy data/forms in MS-Access

Our Solution

SPEC India designed and developed a Business Intelligence and Analytics Solution for the customer which can help them in doing effective data analytics. As per the student’s pattern, this solution helped in marketing campaign and even forecasted & identified students’ competitive exam cleared ratio/interest/retention ratio etc. It covers following features:

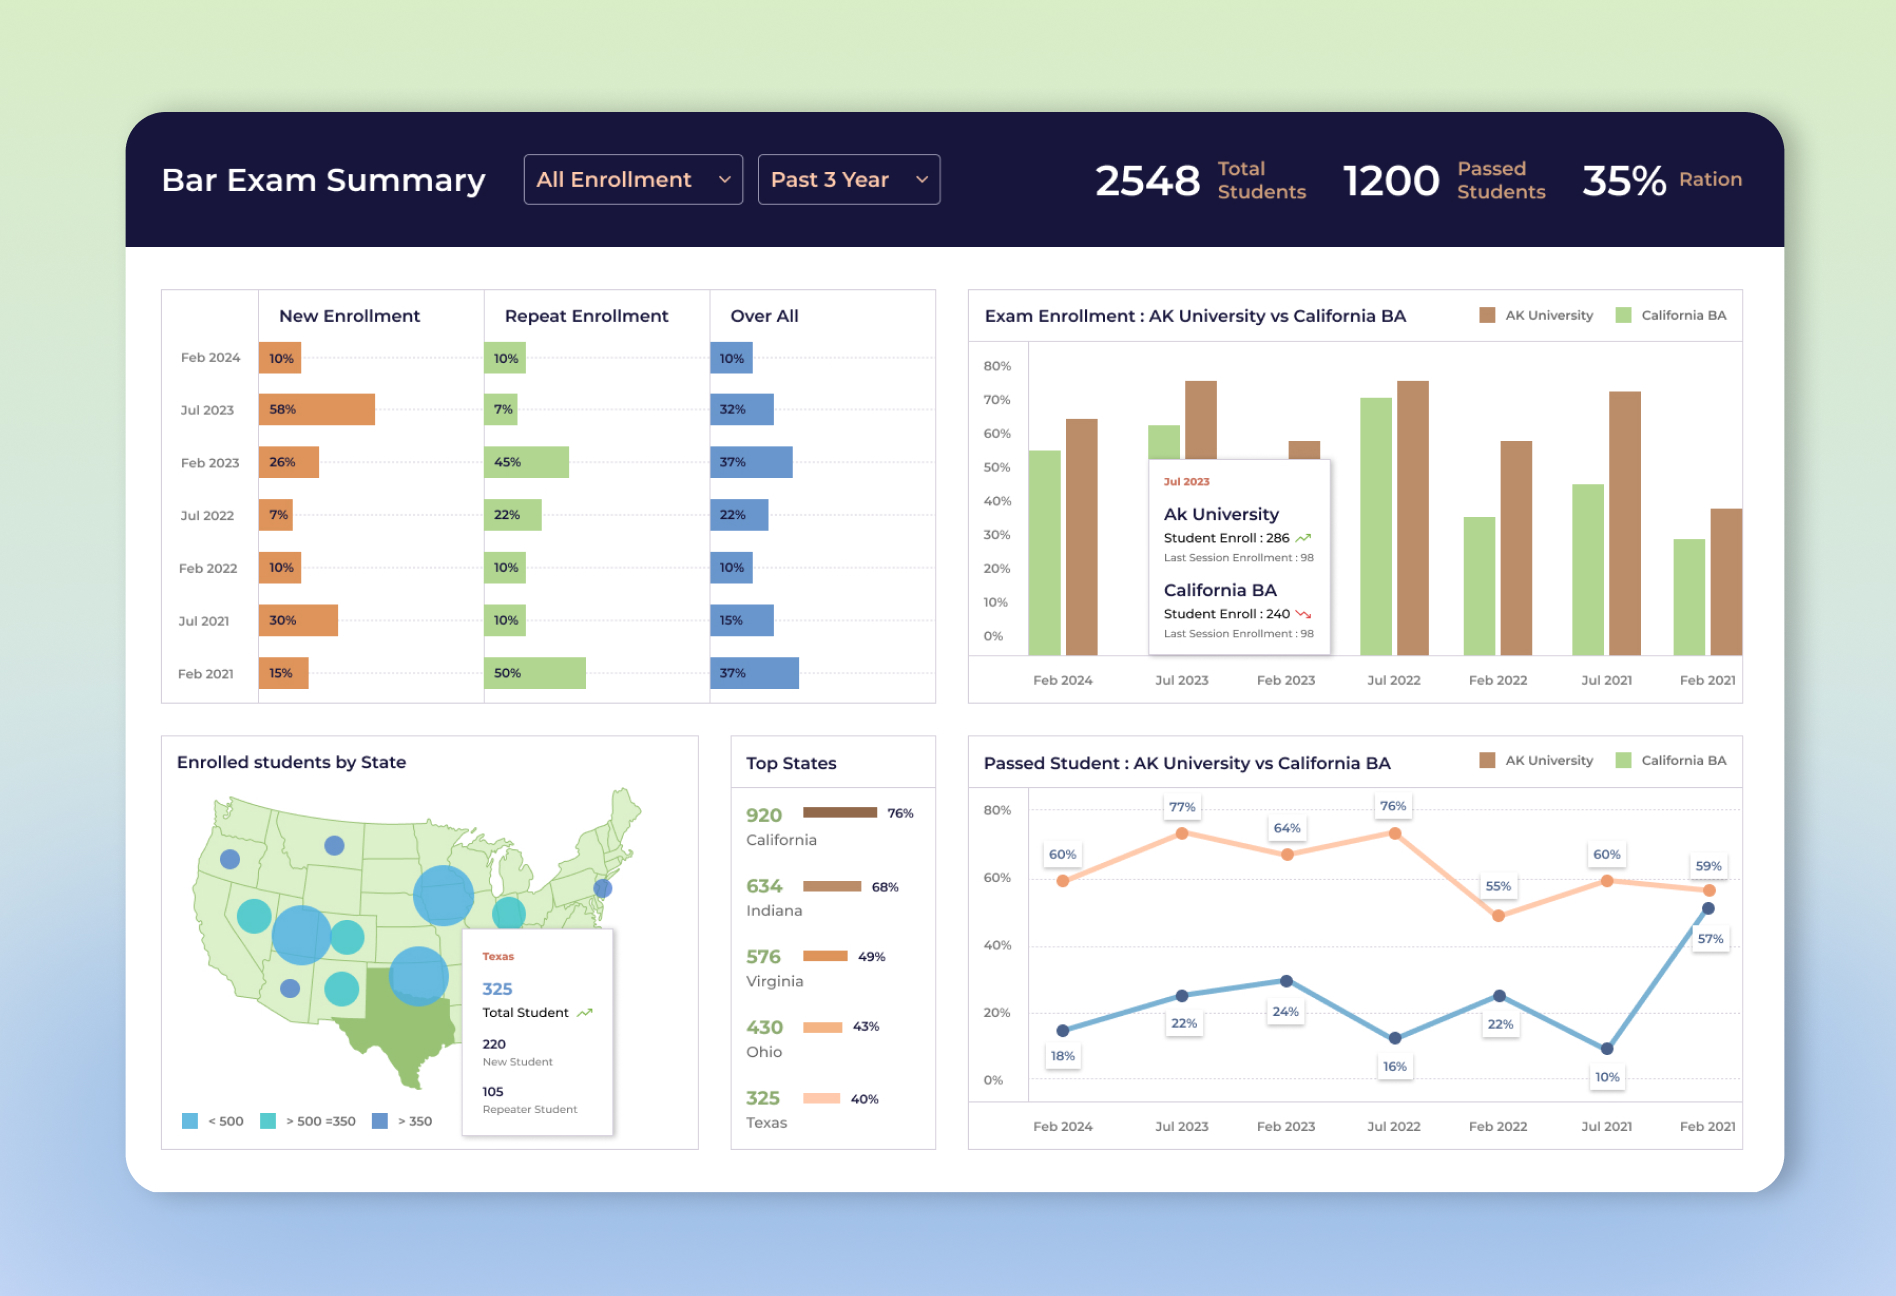
Competitive Exam Passer/Failure Ratio Analysis

Visualization for comparison of university’s result with other universities results over the period.

Displaying the total count of student appeared in the exams, the number of passers among them and ratio of passers within the given duration of the dates.

Detailed analysis of passer/failures of students by gender, by GPA, by LSAT score, etc. for first-timers as well as repeaters.

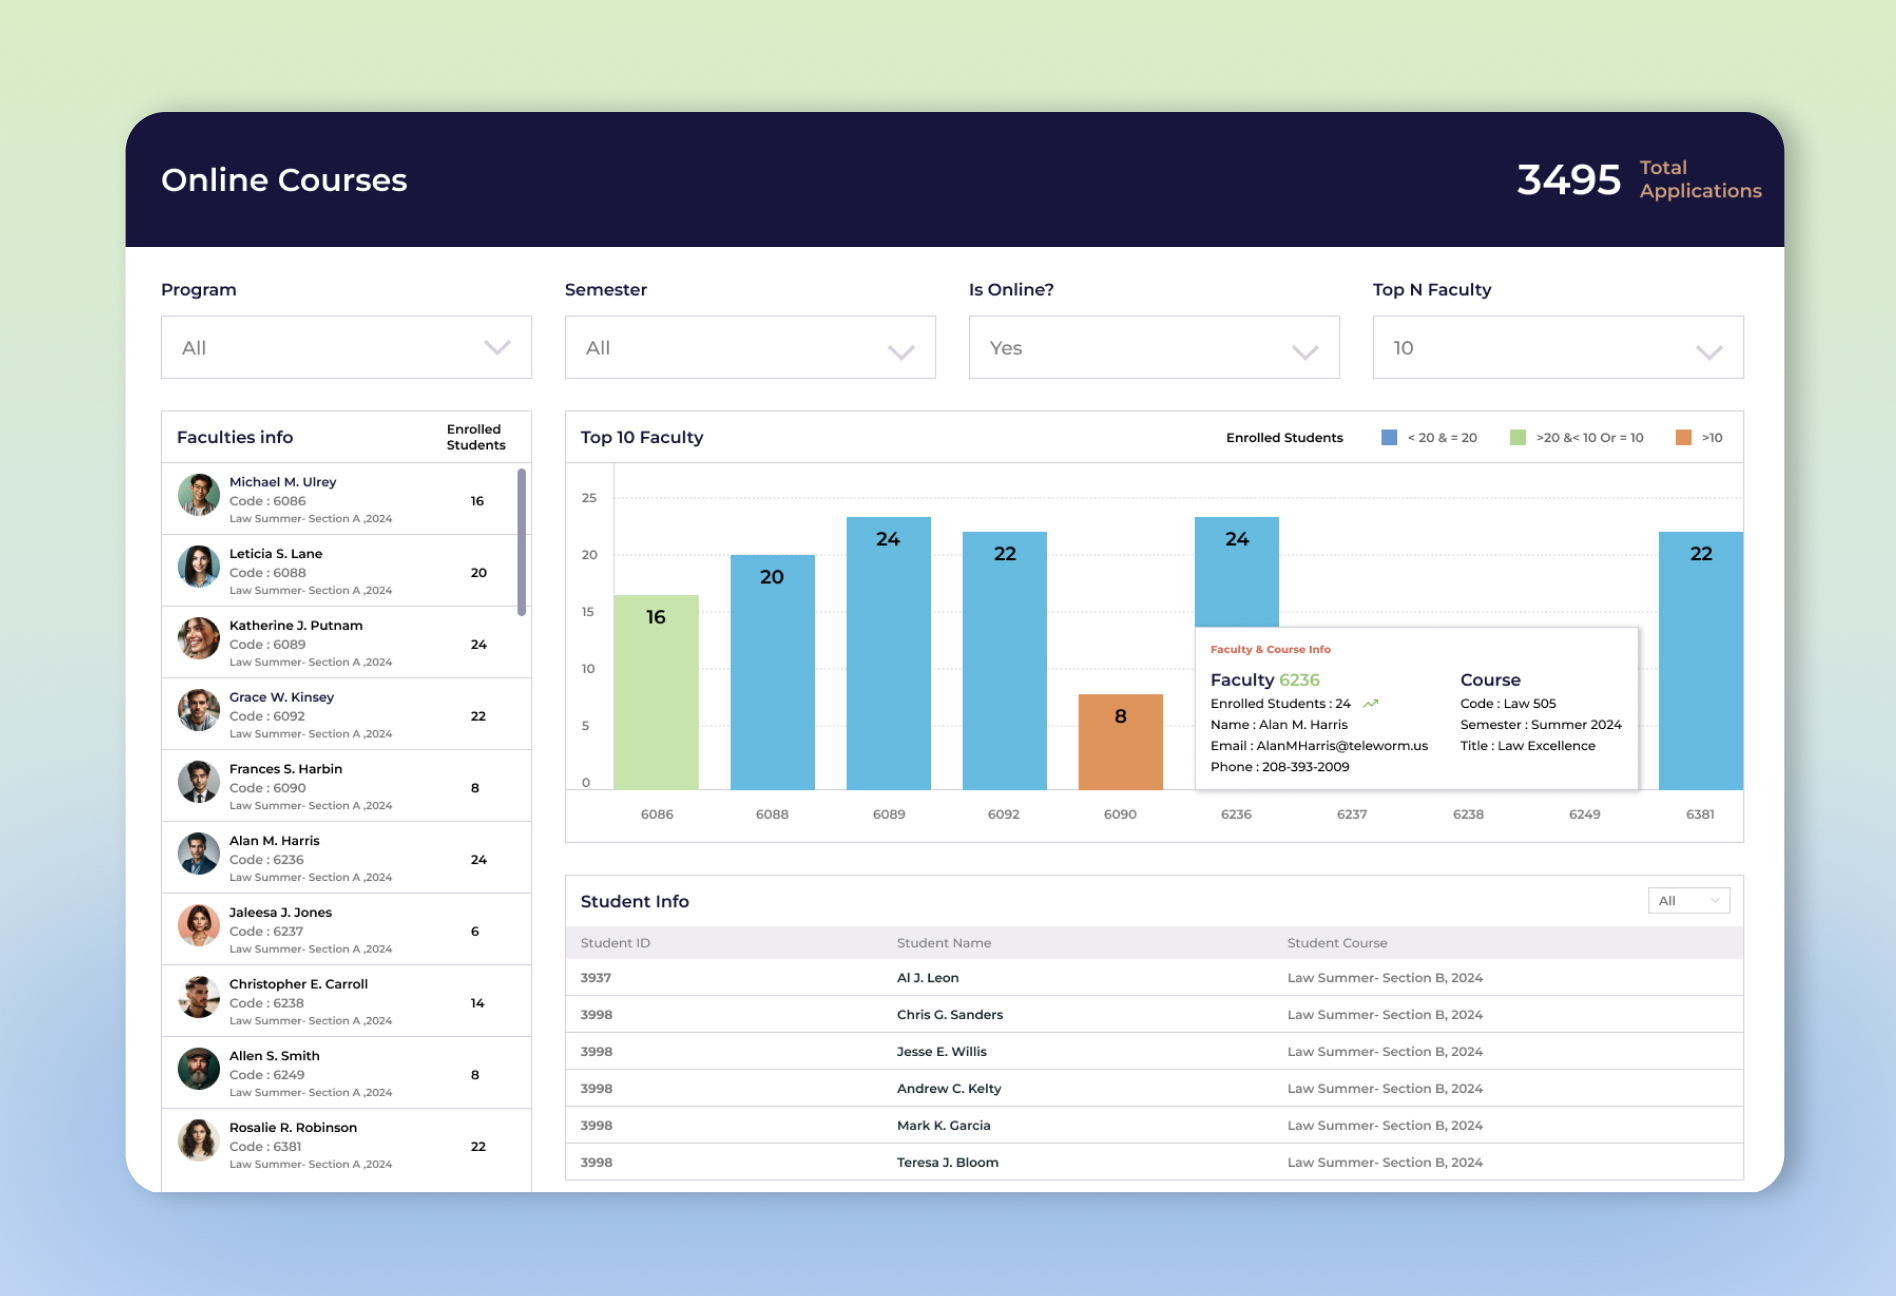
Top Course Trend As Per Enrolled Students

Visualization of enrolled student information by semester by class and by program

Chart showing top ‘N’ registration trends for courses

Visualization can be bifurcated by categories of courses i.e online/offline

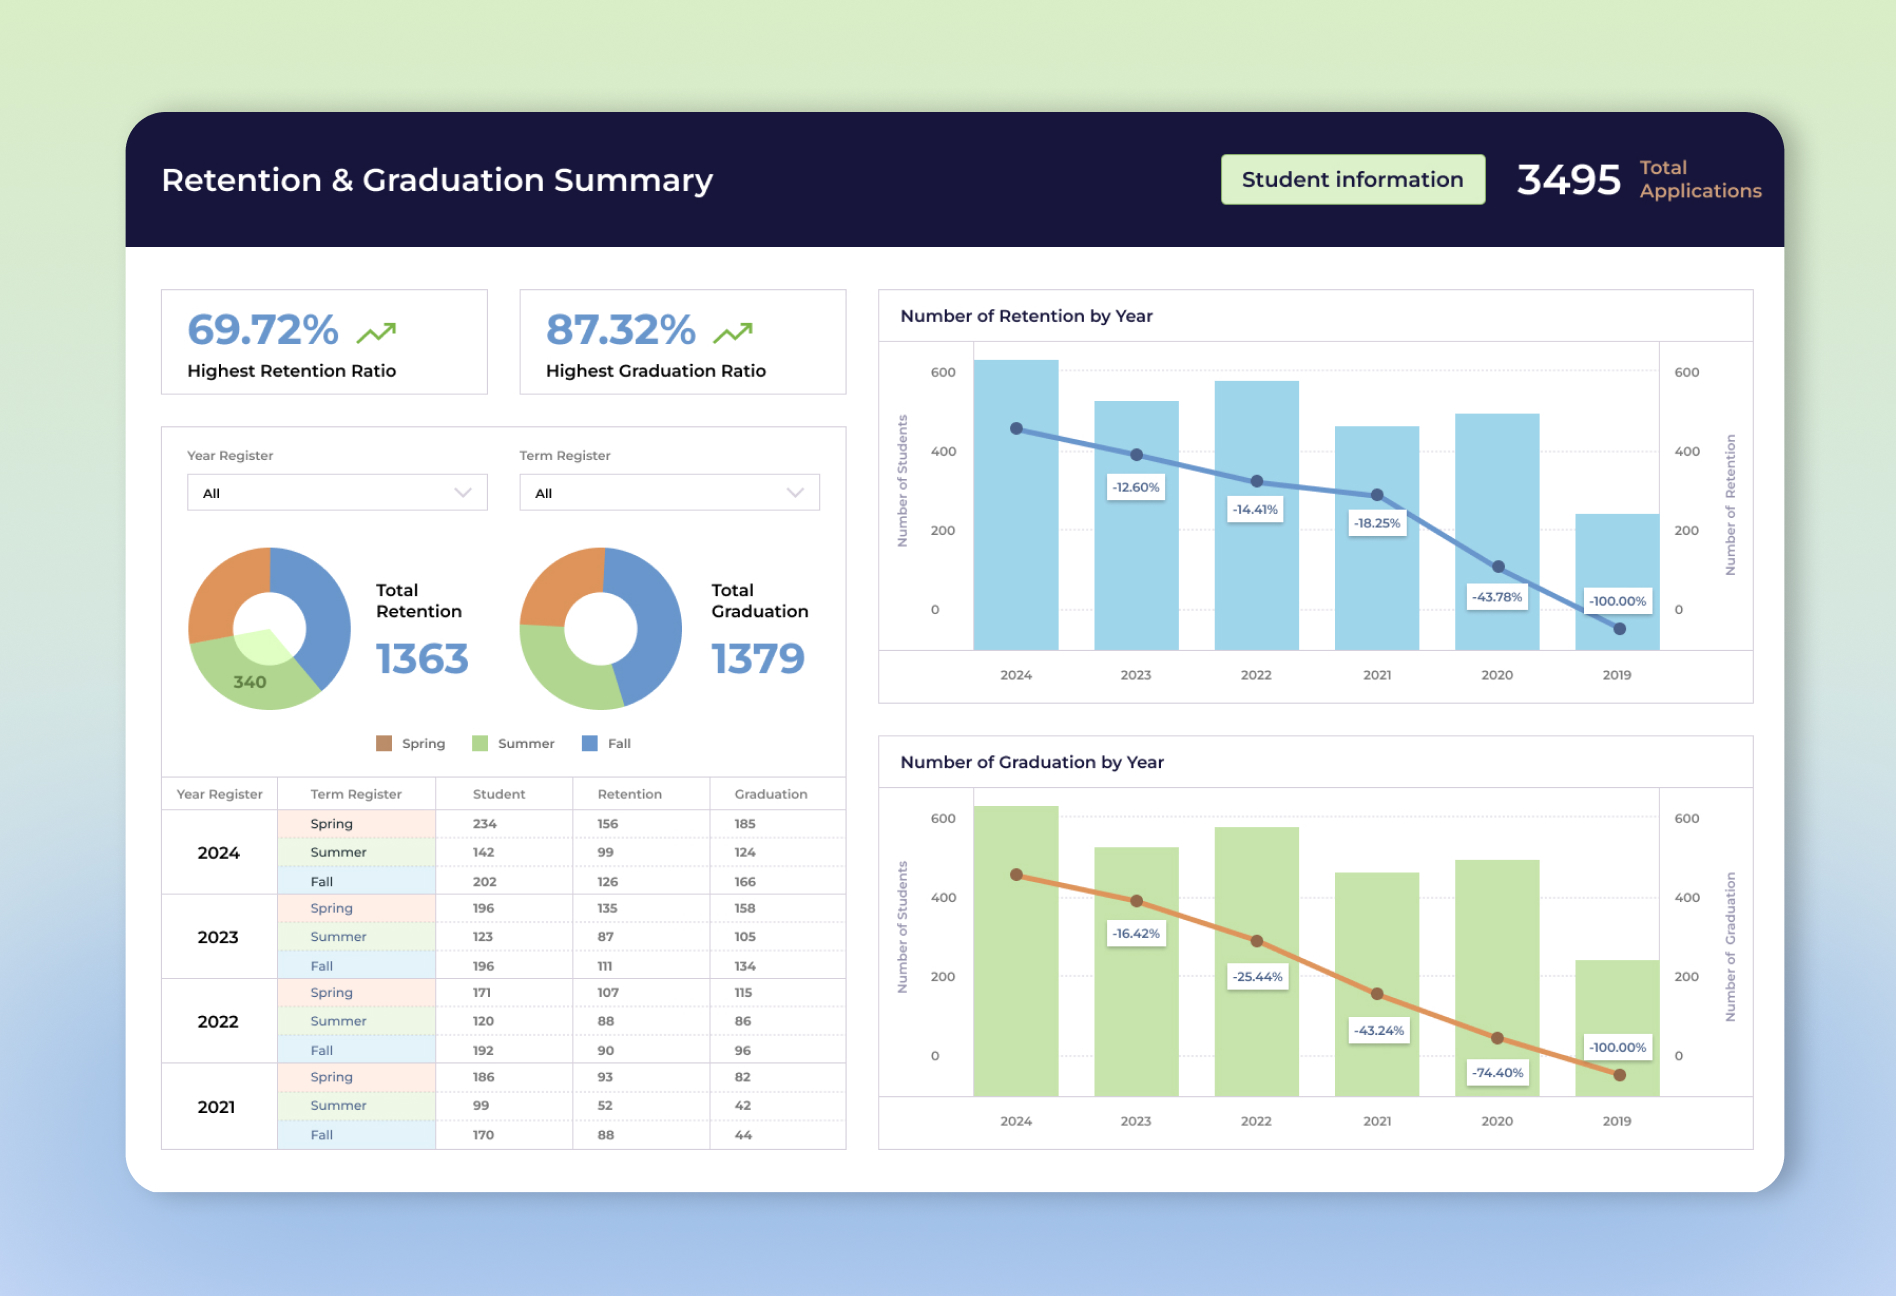
Students Retention & Graduation Summary

Retention trend of students by the year

Graduation trend of students by the year

Drill down student information for each trend

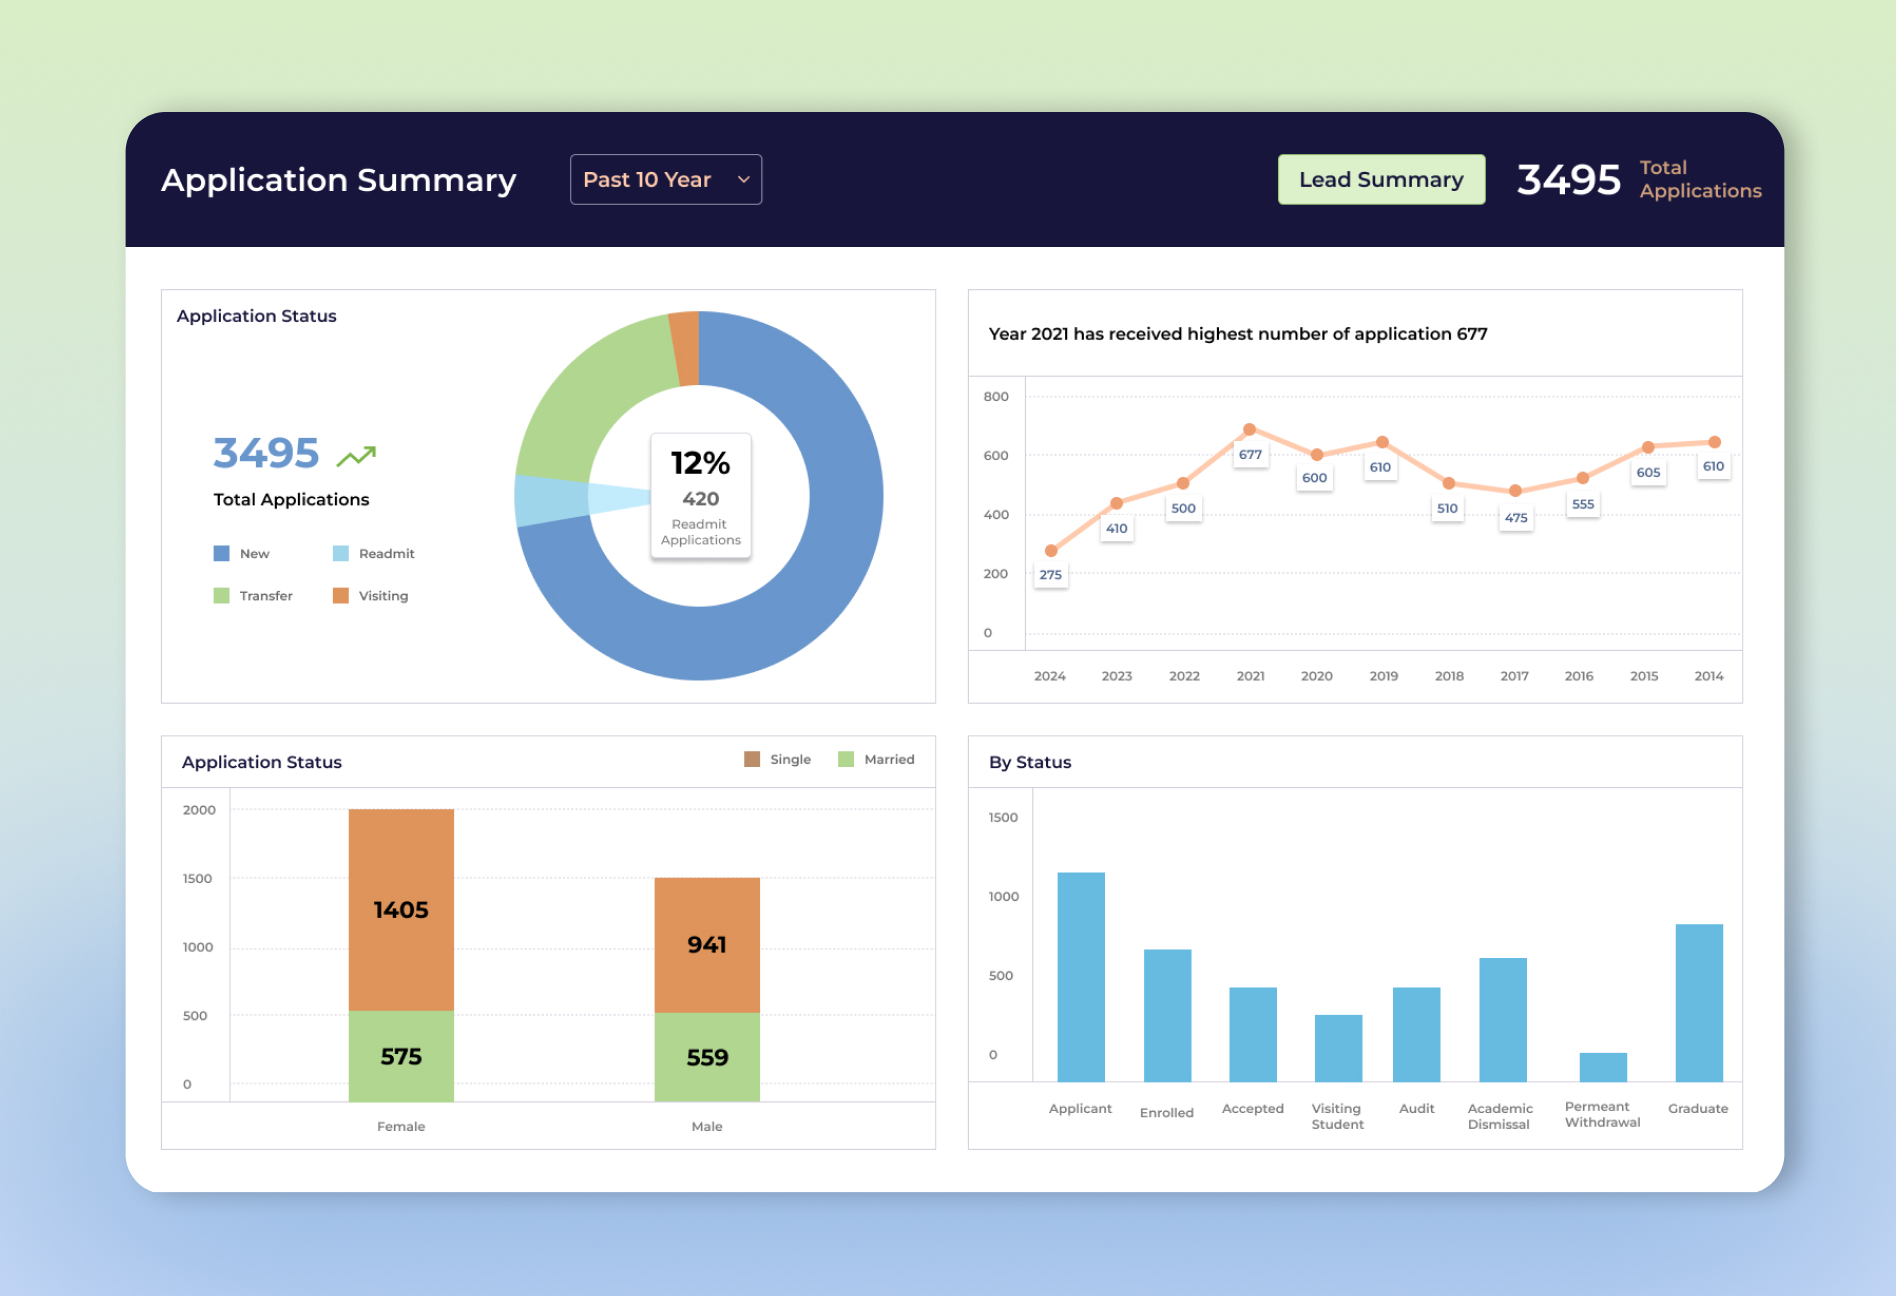
Students Application Status Summary

Application trend of students by type of applicant status (New, visiting or transfer, etc.) for year

Application trend of students by gender for a year

Technical Implementation:

Data warehouse design for visualization

SSIS development to load data into the warehouse

Tableau Dashboard Development for various requirements

Students Registration Trend

Visualization of registration trend of students at the census, live and registration period.

Screens

CS-CTA-1

Similar Project Idea?

Unleash the Potential of Business Intelligence with our BI Developers Showcasing Technically Superior Skills

Submit Request

Technologies & Tools

MS-SQL-Logo
SQL Server
Tableau-Logo
Tableau

Our Process

Research-icon
  Research/Analysis

Our detailed and accurate research , analysis, and refinement leads to a comprehensive study that describes the requirements, functions, and roles in a transparent manner.

Design_icon
  Design

We have a team of creative design experts who are apt at producing sleek designs of the system components with modernized layouts.

Code_icon
  Coding

Our programmers are well versed with latest programming languages, tools, and techniques to effectively interpret the analysis and design into code.

Testing
  Testing

Quality is at the helm of our projects. We leave no stone unturned in ensuring superior excellence and assurance in all our solutions and services.

Launch_icon
  Launch

We have a well-defined, robust, and secure launch criteria that offers us a successful implementation clubbed with detailed testing, customer acceptance and satisfaction.

Business Benefits

SPEC India’s successful implementation of Business Intelligence and Analytics helped University in various analytical goals. It benefitted them in the following ways:

Fetched meaningful insights into the large set of historical data

Forecast retention ratio and effectively design the new programs as per student

Identify performing and non-performing student patterns for competitive exams

Compared results with other universities

Identify the yearly trend of the application by specific age group, gender which can help them to target a set of the group for the campaign.

Let’s get in touch!