


UK
Power BI, OneDrive, Web API
Finance

They were keen to design and develop a business intelligence solution that includes pre-programmed dashboards for different partners that are automatically updated as the data enters the system from a pre-installed Lime Survey plug-in. They wanted outcomes from their Lime Surveys with interactive manners to enable digitization and expansion. They wanted to embed the dynamic dashboards into a live website so users can interact with but not modify or view individual data.
The client was finding it difficult to visualize the business requirement into a unified report to get a consolidated view of different partners. They were looking for a business intelligence application that could get outcome from their Lime Surveys in an efficient and interactive manner to enable the digitization of small-scale business for expansion.
Looking at the challenges faced by the client, SPEC INDIA followed the Fixed Cost model with the Agile approach to develop roadmap and architecture of the product. We designed and launched the Power BI reports and dashboard, after identifying and researching on various modern methodologies.
We have designed a dashboard for the MSME (Micro and Small Enterprise) Digital Maturity Assessment and Product Impact Survey. It is a tool that how their socio-economic outcomes change with the use of digital products and services launched through MAP. We have implemented role-wise reports as well as global reports to get insights data as per partner wise and Administration level.
We have offered the provision to embed the dynamic dashboards to a live website so users can interact with but not modify or view individual data.
Digital maturity assessment survey
Product impact assessment
Global aggregated view using data collected from surveys
Trends and patterns through charts and tables
Filter / show data using selected criteria
Compare against historical data collected from previous survey periods
Display respondent information such as number of responses received, by gender, geography, partner, etc. and total number of responses for each visual
Embedding dashboards with website for user interaction
Access of data through API to a white-labeled microsite to enable public dissemination
Survey question bank
Digital, financial, and business readiness
Demographic information
Digital maturity segmentation
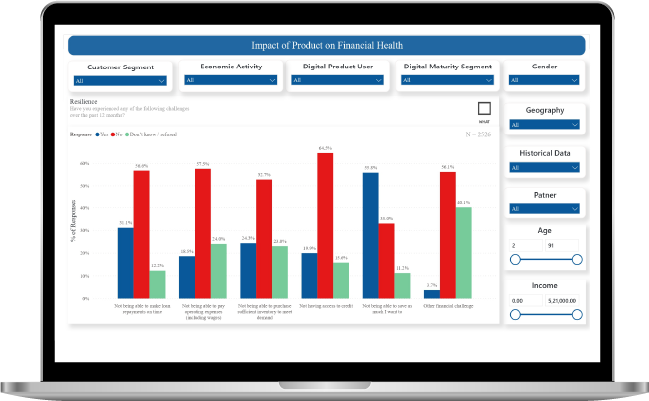
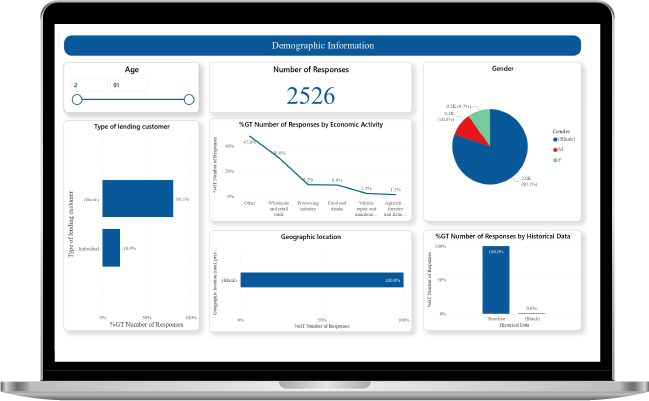
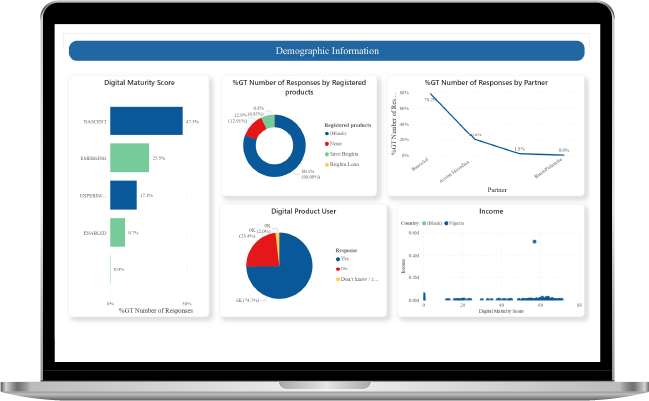
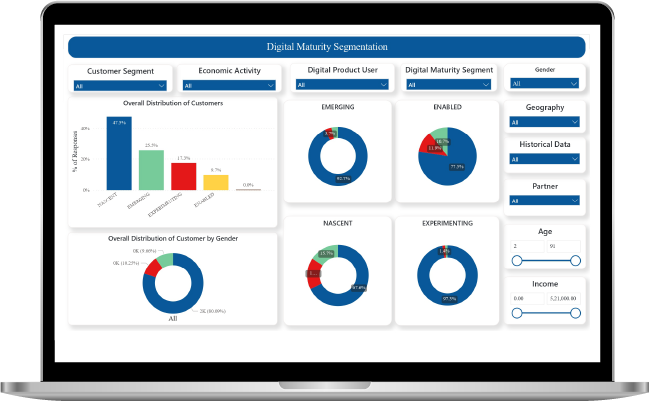
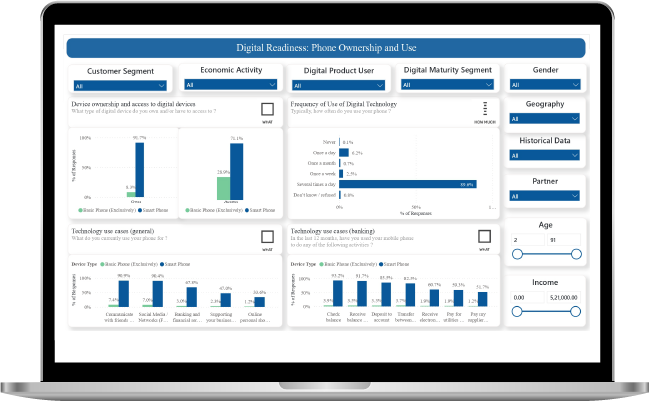
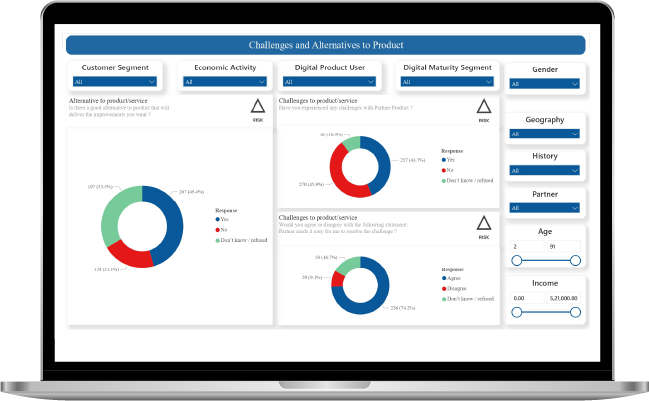

Our power BI dashboards solution would provide you with a clear and better visual display of data making it easier for you to understand.


Our detailed and accurate research, analysis, and refinement leads to a comprehensive study that describes the requirements, functions, and roles in a transparent manner.
We have a team of creative design experts who are apt at producing sleek designs of the system components with modernized layouts.
Our programmers are well versed with latest programming languages, tools, and techniques to effectively interpret the analysis and design into code.

Quality is at the helm of our projects. We leave no stone unturned in ensuring superior excellence and assurance in all our solutions and services.
We have well-defined, robust, and secure launch criteria that offer us a successful implementation clubbed with detailed testing, customer acceptance, and satisfaction.
Insights in an interactive manner
Faster decision-making on product impact
Increased digitization inputs
Viewing dashboards on an ongoing basis
Futuristic view of business information
Dynamic representation and interaction with data
Business growth and job creation
Overall impact of product/service on financial and business wellbeing
SPEC House, Parth Complex, Near Swastik Cross Roads, Navarangpura, Ahmedabad 380009, INDIA.
This website uses cookies to ensure you get the best experience on our website. Read Spec India’s Privacy Policy