Go Green One tree
One life
Trees
Loading...

Expense Monitoring & Analytics Portal for a Fashion Brand

The client is a renowned fashion brand specializing in clothing and accessories in the Middle East, headquartered in Kuwait. With operations spread across 6 countries and approximately 15 brands, the company manages around 140 stores offering a diverse range of clothing, luxury items, accessories, footwear, and fast fashion products.

  • Industry
    Lifestyle
  • Country
    UAE
Technologies
Expense Monitoring and Analytics
Years In Business
36+
Years In Business
Projects Delivered
3000+
Projects Delivered
Happy Clients
200+
Happy Clients
Countries Served
40+
Countries Served

Client Goals and Expectations

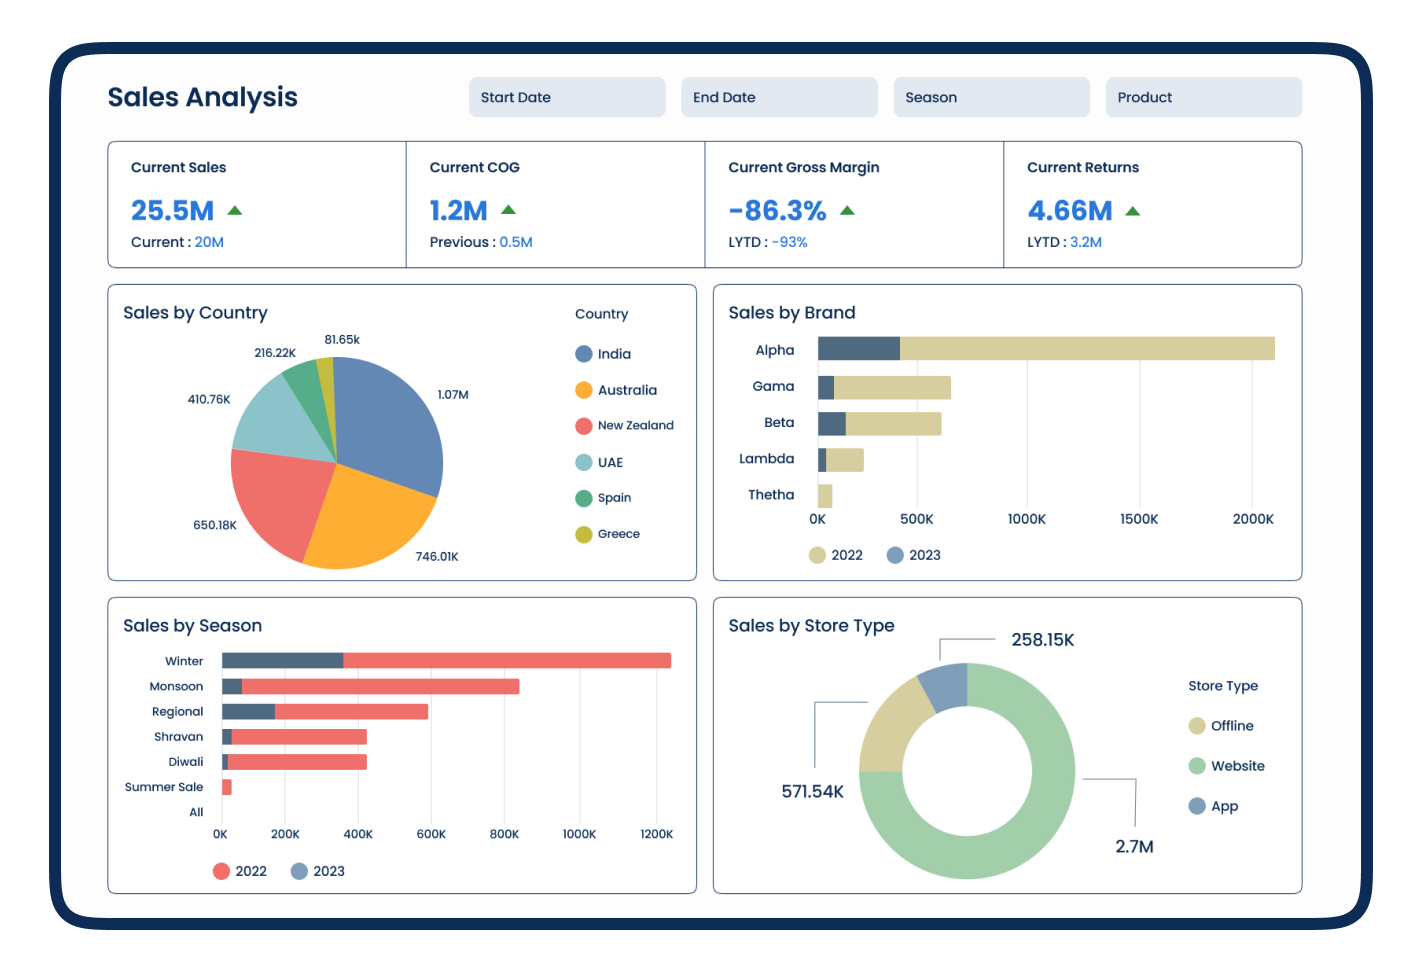
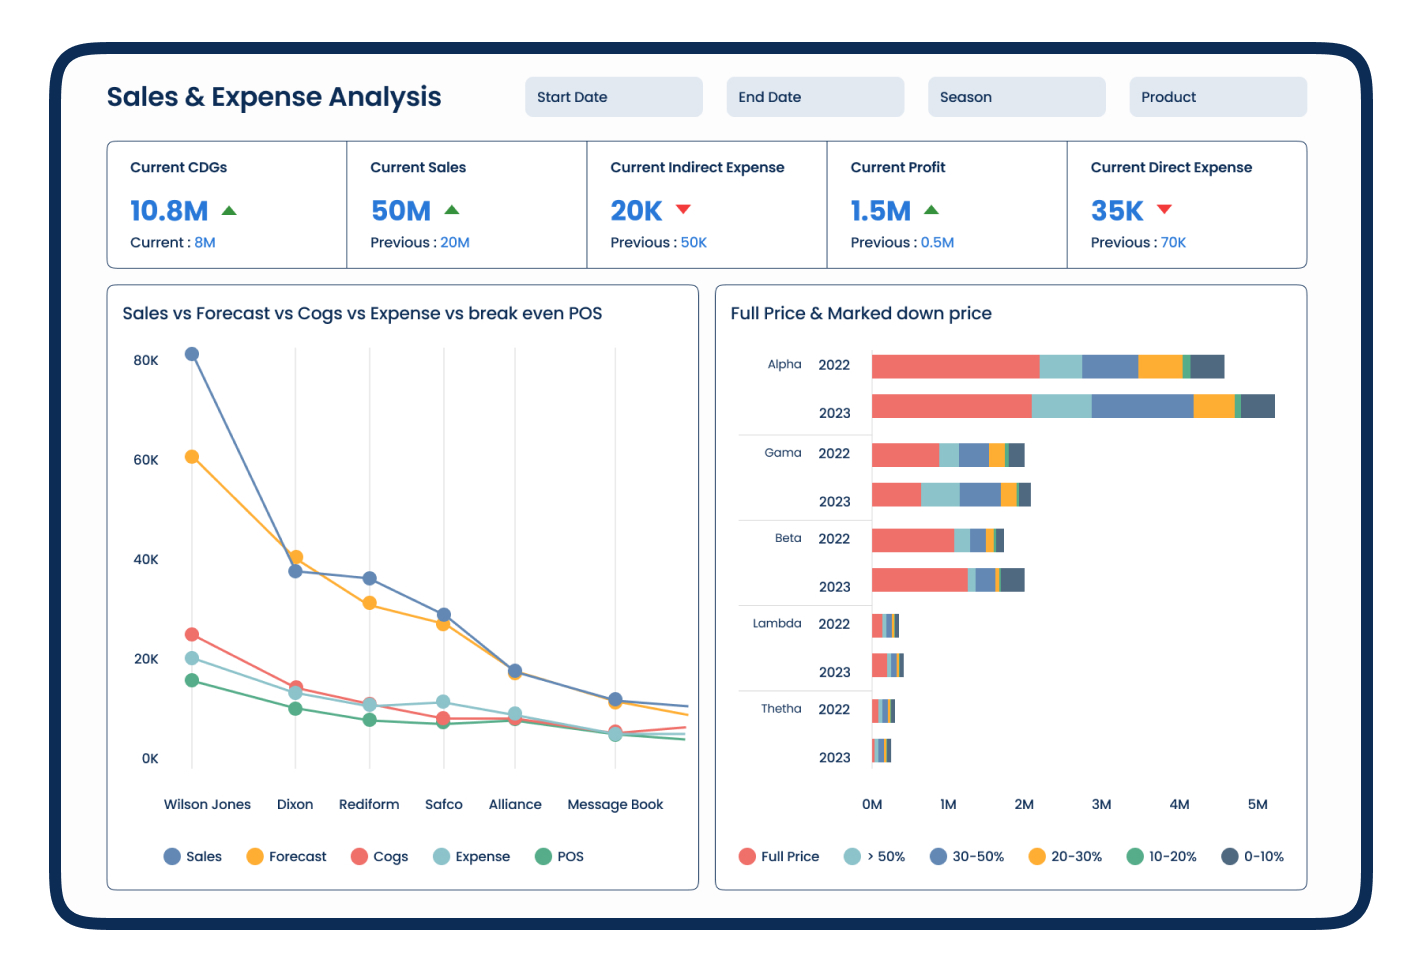
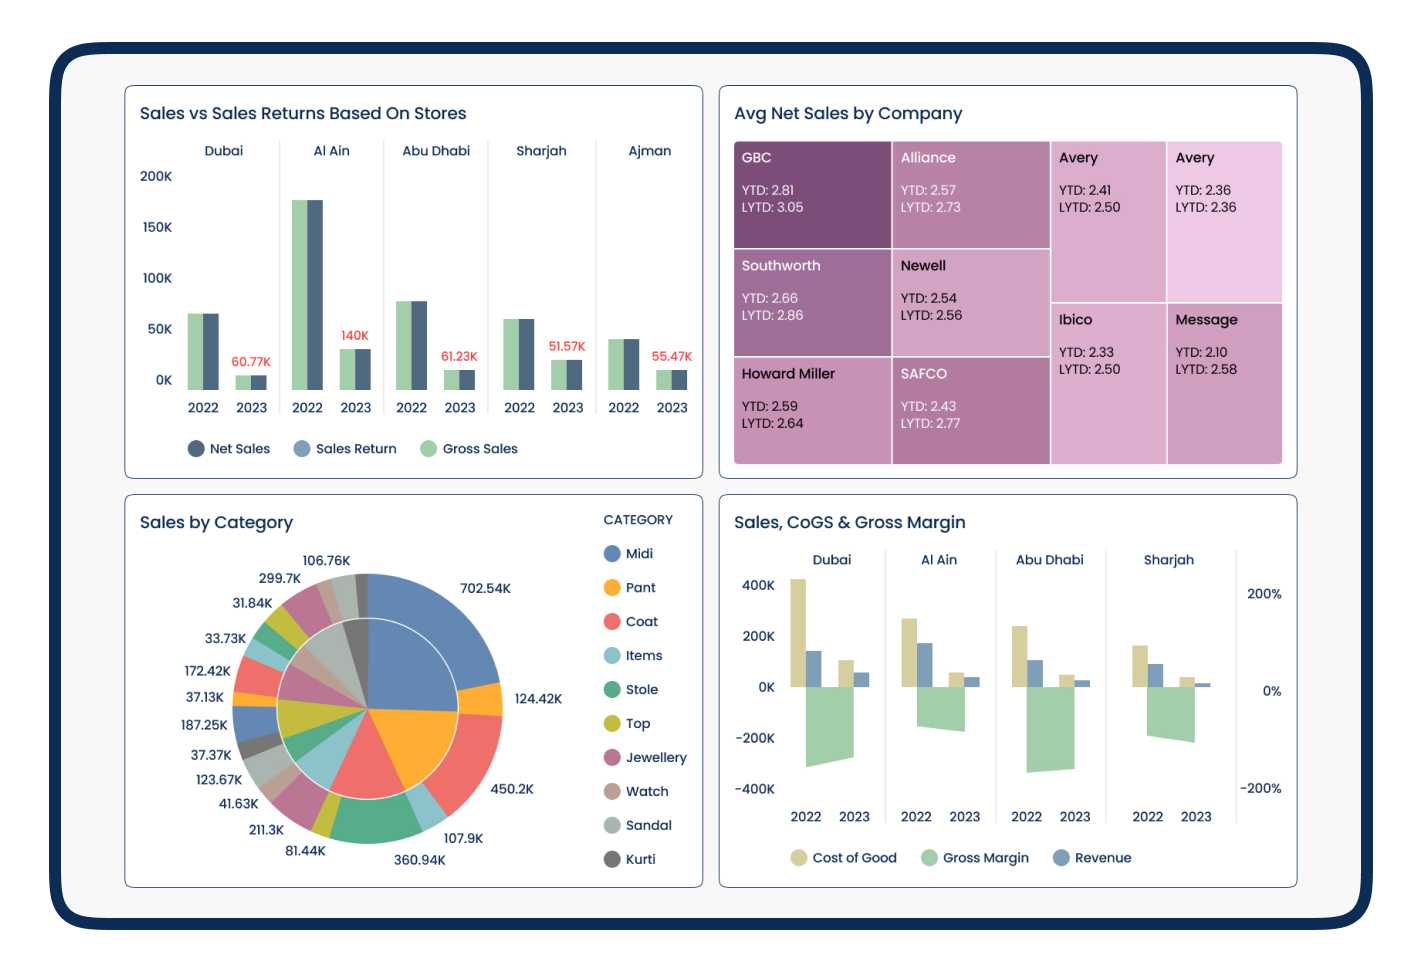
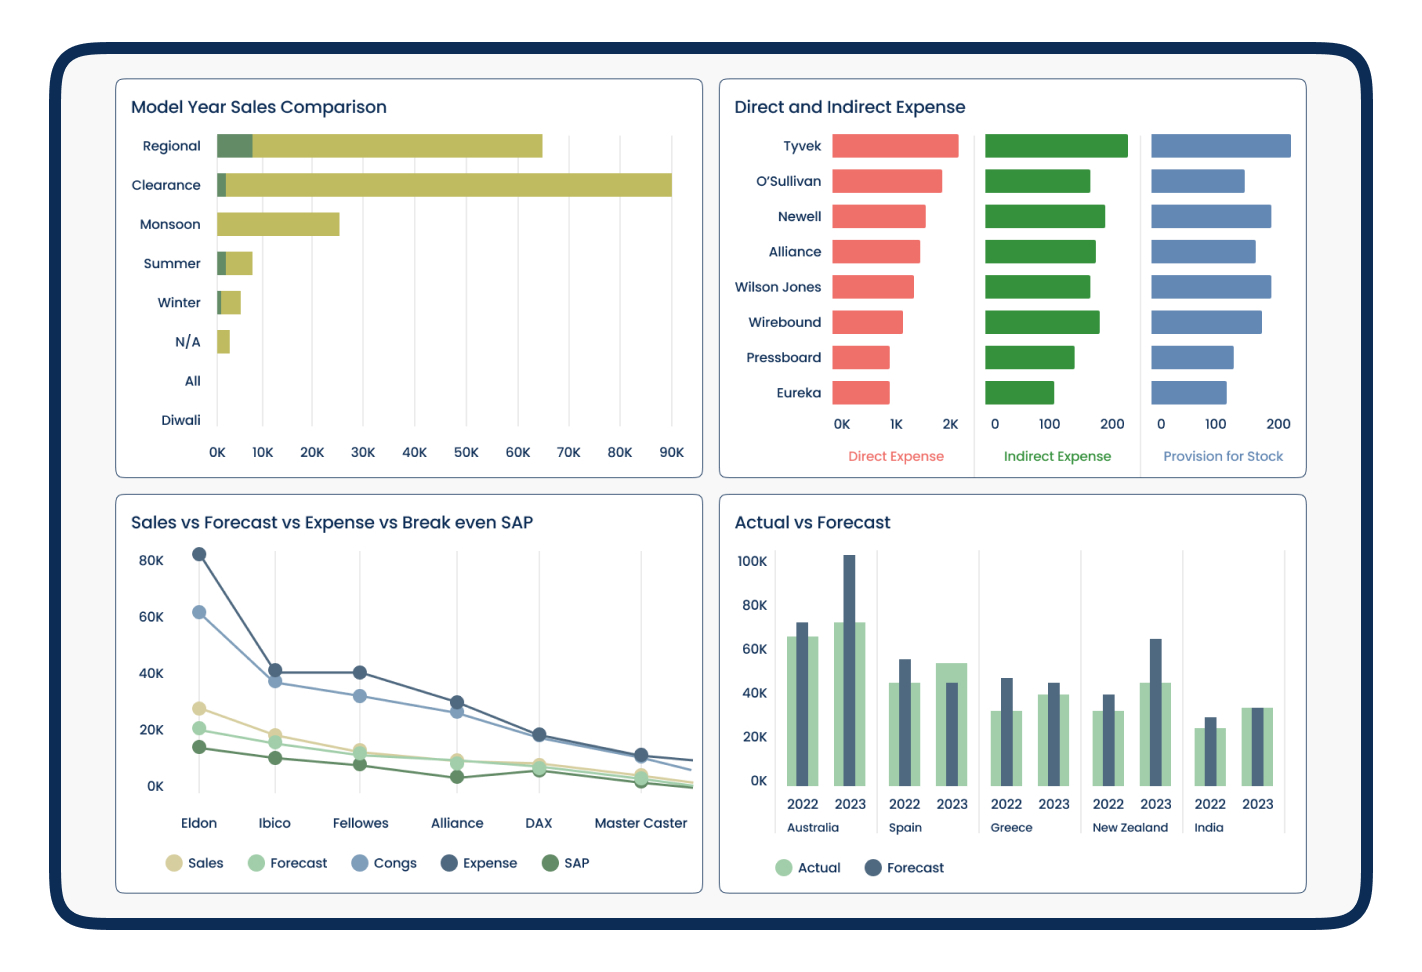
The client aimed to design and develop a comprehensive business intelligence (BI) solution to effectively analyze expense-related metrics.

  • Analyze expense-related metrics including closing amount balance, profit & loss statements, and expense-related KPIs.
  • Gain detailed insights into financial data.
  • Facilitate better decision-making processes.
  • Improve financial management capabilities.


Challenges Faced by the Client

Complex Reporting Needs

Complex Reporting Needs

The client struggled to create a set of reports and dashboards that provided detailed insights into their expense-related KPIs.

Data Management

Data Management

They faced challenges due to the vast amount of data sourced from different databases located across various locations.

Dashboard Performance

Dashboard Performance

Maintaining optimal performance for the dashboards with such extensive data was difficult hence they approached us to develop a comprehensive power BI solution.

Enhanced Interactivity

Enhanced Interactivity

They required functionalities like background customization for specific table columns and dynamic fetching of product images upon interaction with the dashboard.

  • We provided a structured development approach encompassing research, analysis, development, design, testing, and deployment phases.

  • Our team developed and launched customized BI reports and dashboards tailored to the client's specific requirements.

  • We utilized Tableau Online and Tableau Desktop for robust visualization capabilities, ensuring comprehensive data analysis.

  • Our experts implemented Tableau Actions to enable dynamic fetching of product images based on user interactions, enhancing dashboard interactivity.

  • We optimized dashboard performance by selectively hiding unused data fields and utilizing efficient data extracts, ensuring smooth and efficient data visualization.
How We Confronted the Challenges

Project Glimpse

Fashion companies will face economic headwinds, technology shifts, and an evolving competitive landscape in 2024. However, shifting consumer priorities will continue to offer opportunities.

Core Features

Data Table Dashboard
Expense Analysis
Expense Analysis
Sales Dashboard
Sales Dashboard
Sales Inventory Analysis
Profit & Loss Statement
Expense-Based KPIs
Expense-Based KPIs
Closing Amount Balance
Background Customization
Dynamic Image Fetching

Our Workflow Journey

01
Research and Analysis

Our workflow journey began with thorough research and analysis of the client's requirements and challenges. We conducted in-depth assessments to understand their business processes and identify key areas for improvement in expense monitoring and financial analysis.

Requirement Analysis
02
Development and Design

Leveraging our expertise, we developed a tailored BI solution using Tableau Online, Tableau Desktop, and Oracle. Our team focused on creating intuitive dashboards and reports that provided actionable insights into expense-related metrics and financial performance.

Design and Development
03
Testing and Refinement

Rigorous testing was integral to our workflow journey. We conducted multiple rounds of testing to ensure the accuracy, functionality, and performance of the BI solution. Feedback from stakeholders guided our refinements to enhance usability and effectiveness.

Testing
04
Deployment and Support

Upon successful testing, we deployed the BI solution seamlessly into the client's infrastructure. Our support extended beyond deployment with comprehensive training sessions and ongoing support to empower users and ensure maximum utilization of the new system.

Deployment
05
Continuous Improvement

Our workflow journey continues with a commitment to continuous improvement. We monitor the solution's performance, gather user feedback, and implement enhancements to meet evolving business needs and maintain optimal functionality.

User Training

Results and Achievements

  • 01.
    Streamlined Expense Monitoring

    Enabled easy monitoring of expenses across different stores, facilitating monthly, quarterly, and yearly comparisons.

  • 02.
    Performance Optimization

    Achieved optimal dashboard performance even with complex visualizations, ensuring smooth user experiences.

  • 03.
    Enhanced Decision-Making

    Provided user-specific, effective, and well-optimized visualizations and dashboards to support informed decision-making.

  • 04.
    Improved GUI

    Delivered an enriched graphical user interface (GUI) for a better user experience.

  • 05.
    Insightful Expense Analysis

    Allowed detailed analysis of closing balances versus budget allocations, improving financial management.

Expense Monitoring and Analytics - Result