Go Green One tree
One life
Trees
Loading...
Client-Business-Goal

Client’s Business Goals

They were keen to design and develop a one-stop marketing business intelligence solution that can get meaningful insights from the biopharma company data, that is unified, intuitive, and helps in taking effective business decisions. They were looking for Power BI reports for the BioPharma domain for Bio Processing tracker, Manufacturing and Pipeline Tracker, and CMO tracker to get insights for various features and specifications and available facilities of companies.

Key Challenges

The client was finding it difficult to cleanse the data and present in a proper format that can be leveraged to gather insightful information based on the product type.

Our Approach

Looking at the challenges faced by the client, SPEC INDIA followed the Fixed Cost model with the Agile approach to develop roadmap and architecture of the product. We designed and launched the Power BI reports and dashboard, after identifying and researching on various modern methodologies.

Our Solution

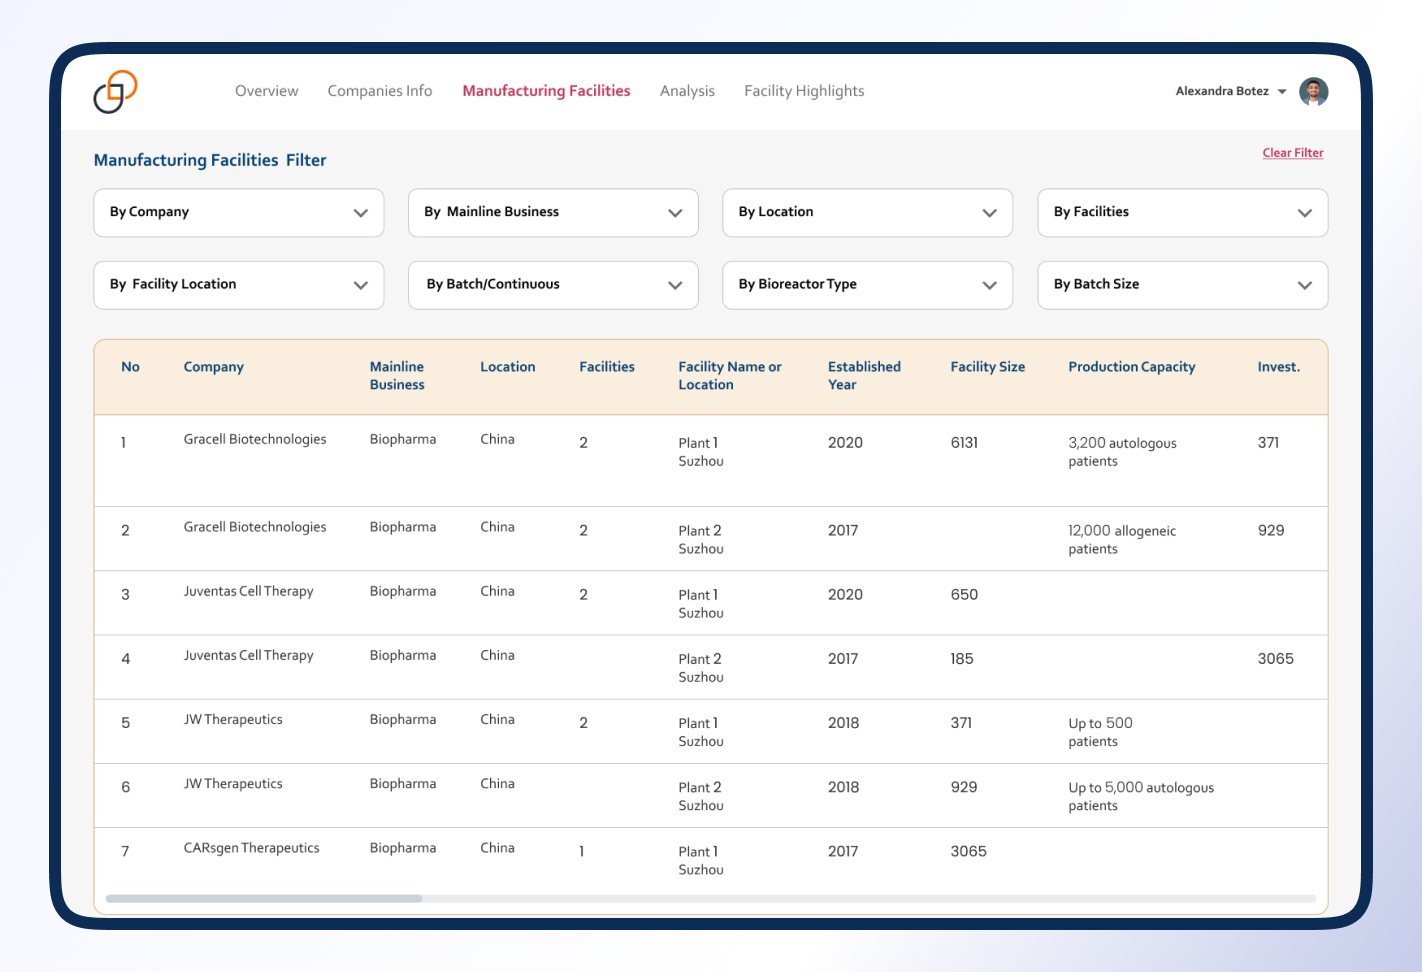
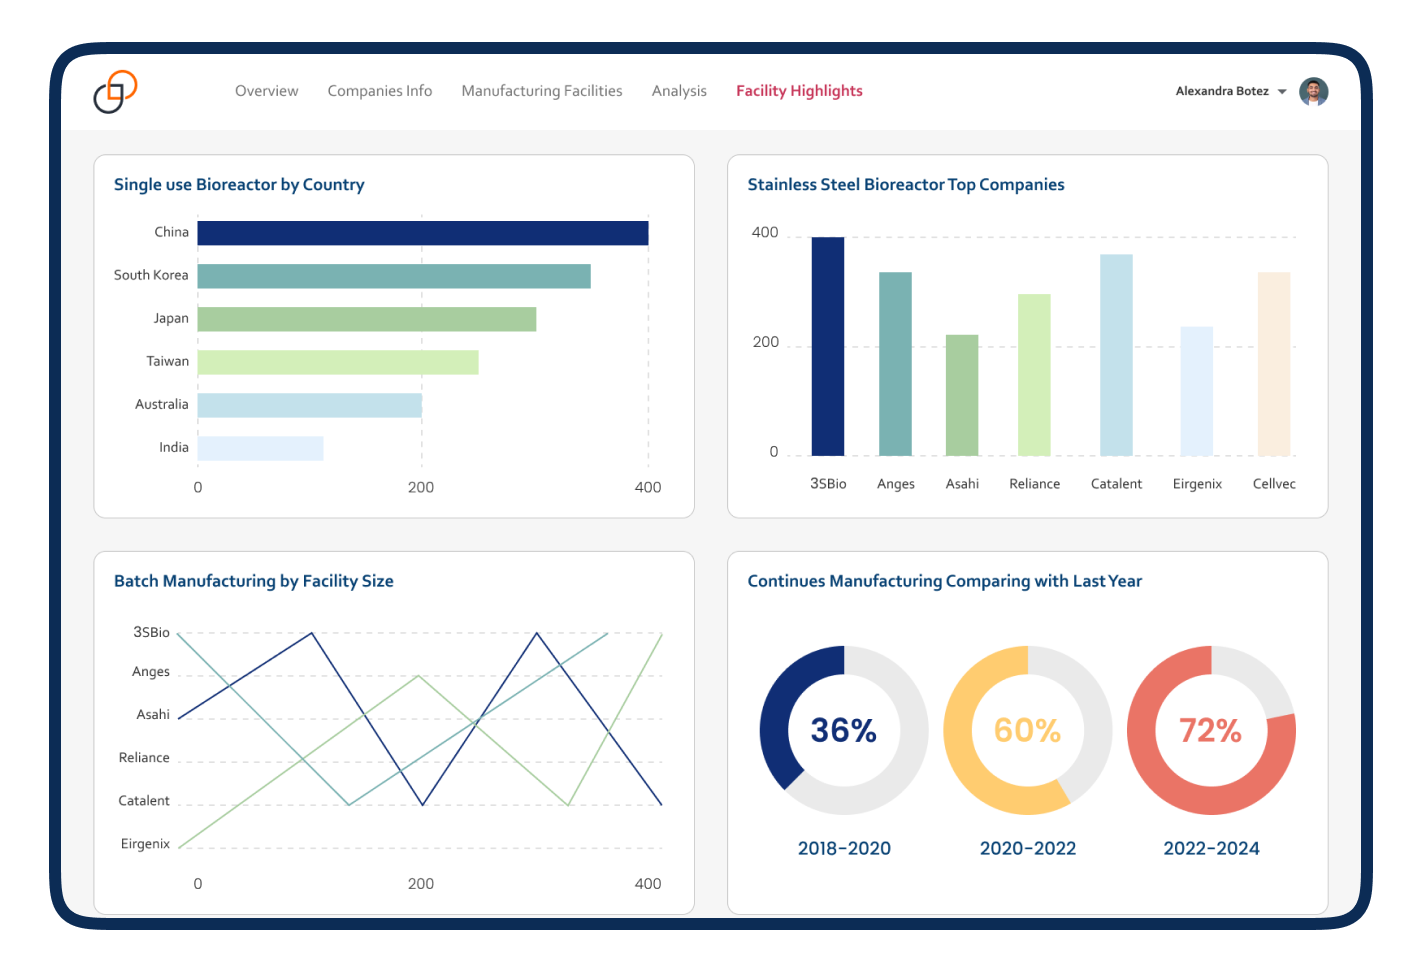
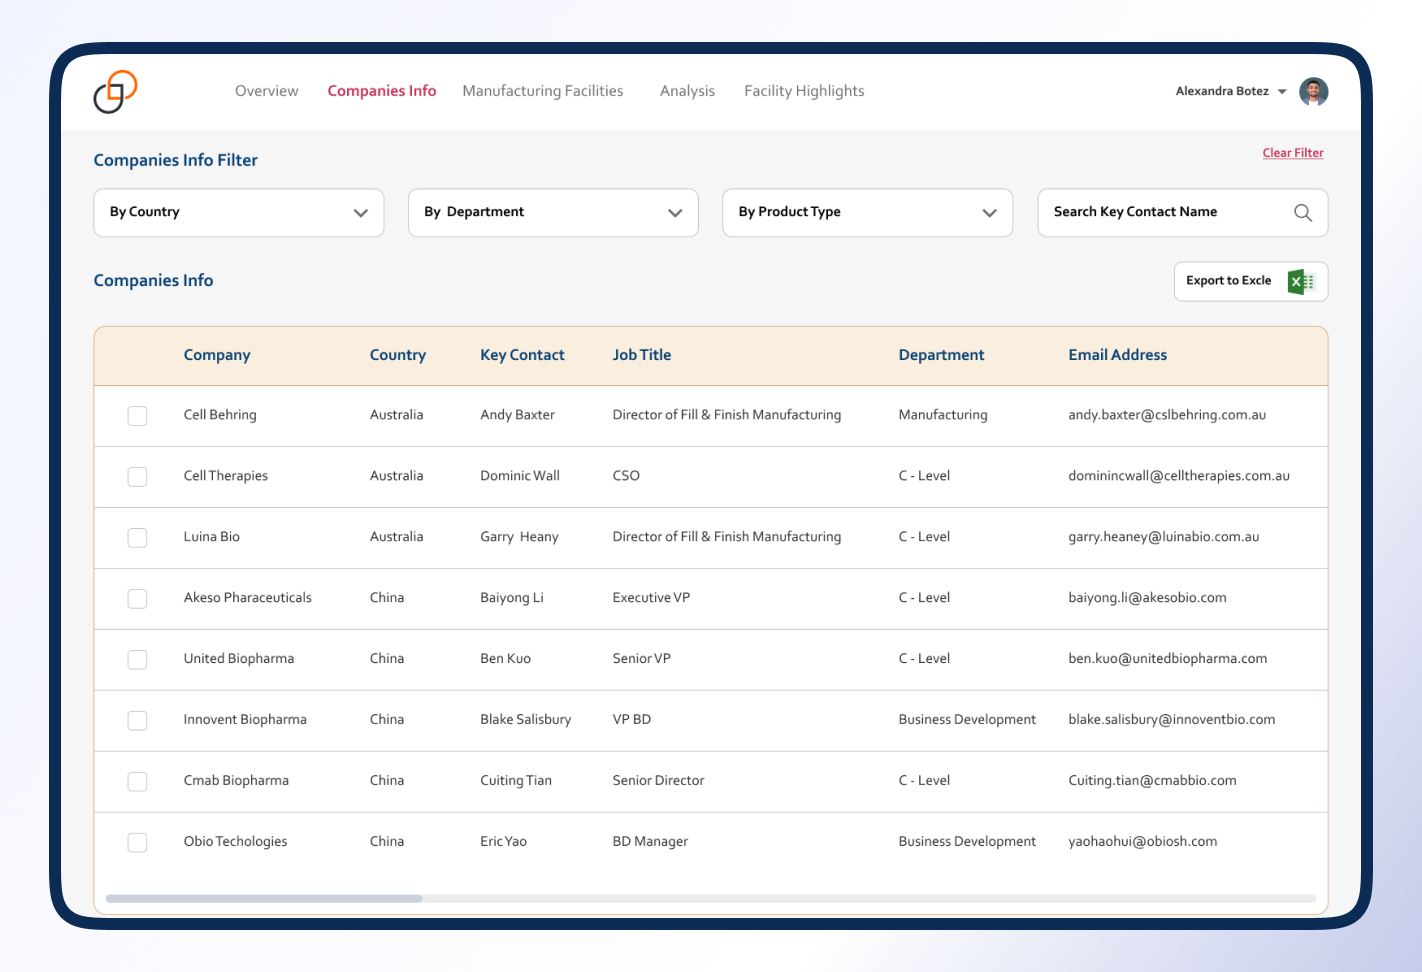
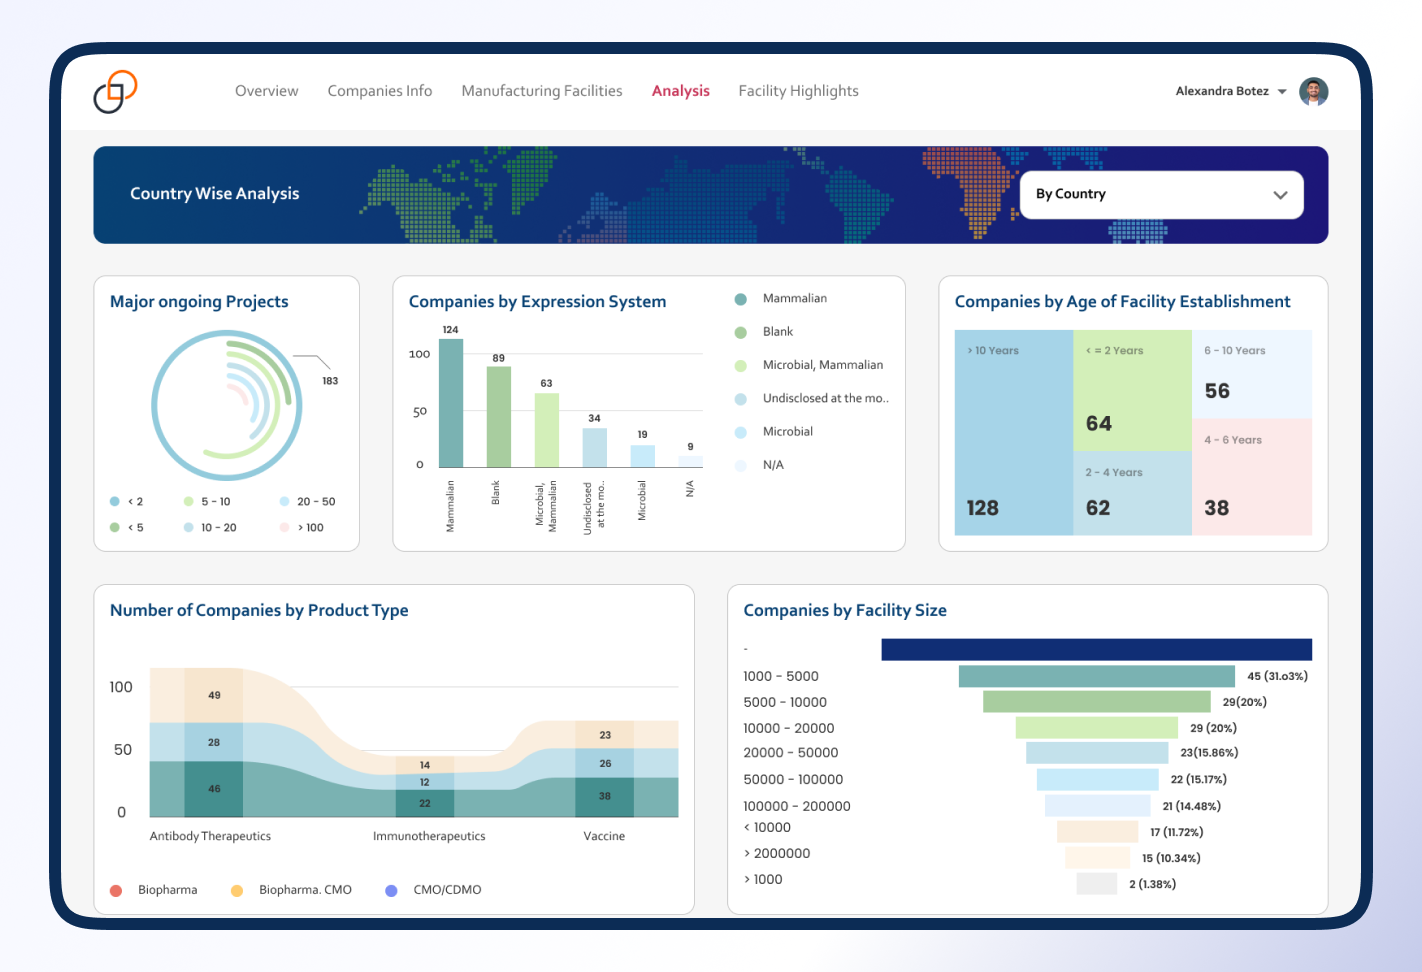
We have designed and developed Power BI reports that offer intuitive information for different features and company specifications with available facilities for companies. It includes dashboard development for the BioProcessing Tracker, Cell and Gene Therapy Tracker, CMO Tracker, Manufacturing, and Pipeline Tracker to get insights. We have cleaned and transformed data in Power Query by identifying patterns of Product type and created a model in such a way that end users can easily get information as per Product Type wise.

Using the web connector of SharePoint from Power BI we have connected SharePoint Excel and created a data model in Power BI for Report development. For User wise access we can manage it from the Power BI service to share it with users.

After development of the Data Model, we created visuals as per requirements using the Power BI Desktop tool and published in Power BI Service. For Calculation, we have used DAX (Data Analysis Expressions).

Key Inclusions

Country based Cell and Gene therapy tracker

Pipeline tracker, CMO tracker

Manufacturing facilities tracker

Facility analysis and highlights

Bioprocessing tracker showing stages, technology, production capabilities, bioreactor information, mergers and acquisitions, partnerships, company management contacts etc.

Country wise analysis

Dynamic dashboards allowing users to interact with data

Customization of look and feel based on formatting requests

Embedded dashboard with website for data interaction

Screens

CS-CTA-1

Do You Want To Gain Better Insights For Your Business?

We have helped a number of global clientele with our analysis and reporting services to drive better performance based on data

Let's Talk

Technologies & Tools

Power-BI-Logo
Microsoft Power BI
sharepoint-logo
Share Point

Our Process

Research-icon
  Research/Analysis

Our detailed and accurate research, analysis, and refinement leads to a comprehensive study that describes the requirements, functions, and roles in a transparent manner.

Design_icon
  Design

We have a team of creative design experts who are apt at producing sleek designs of the system components with modernized layouts.

Code_icon
  Coding

Our programmers are well versed with latest programming languages, tools, and techniques to effectively interpret the analysis and design into code.

Testing
  Testing

Quality is at the helm of our projects. We leave no stone unturned in ensuring superior excellence and assurance in all our solutions and services.

Launch_icon
  Launch

We have well-defined, robust, and secure launch criteria that offer us a successful implementation clubbed with detailed testing, customer acceptance, and satisfaction.

Business Benefits

Biopharma market intelligence

Growth and opportunities discovery for the Bio Pharma segment

Competitive analysis and intelligence for companies

Easy tracking facility-wise information for various products and relevant phases of development

Data analysis and interpretation

Decision support and validated information

Trends and patterns in data visually, through charts and tables

Ability to filter/show data using selected criteria

CS-CTA-2

Do You Have Similar Development Requirements?

Discuss your requirements with us and our developer will get started with your project right away.

Connect With Us