

IoT-Based Smart Water Supply Monitoring Solution
Our client was based in India and wanted to enhance water management and sanitation services. The water supply data monitoring system required improvement at multiple locations while the organization sought to create an IoT-based system with real-time dashboard functionality to track water availability quality and pressure distribution.
-
Industry
Water & Sanitation -
Country
India
Technologies
 Azure Cosmos DB
Years In Business
Projects Delivered
Happy Clients
Countries Served
Business Goals
The client aimed to build a robust business intelligence solution that could:
- The system should record real-time monitoring of water supply conditions, along with chlorine measurements and water pressure information.
- Staff should monitor the daily water consumption per capita, measured in liters, at various locations as a single metric.
- Provide meaningful insights through custom reports and dashboards for both internal and public stakeholders.
Business Challenges
Data Consolidation
Collecting data from multiple locations was very challenging and above that having a single view of water supply and quality metrics was hard to get.
Lack of Centralized Monitoring
The firm requires a synchronized monitoring platform to monitor current water pressure conditions and chlorine measurement. But they didn’t have any tool where they could check it.
IoT Device Log Management
Management of error logs from IoT devices together with diverse regional data proved to be a major issue. The client operated multiple devices throughout different geographic locations, so he needed to implement the IoT in their workplace.
Limited Data Visualization
They didn’t have the right tools to turn raw data into clear, visual insights, making it tough to make quick, informed decisions when it mattered most.
Technical Solution
-
Agile Development for Flexibility
The implementation followed an Agile methodology with Time & Material terms. Why? The Time & Material model provided us with flexibility to improve as we worked alongside the client throughout all development stages from initial thought development to ultimate execution.
-
Custom Dashboards Built with Power BI
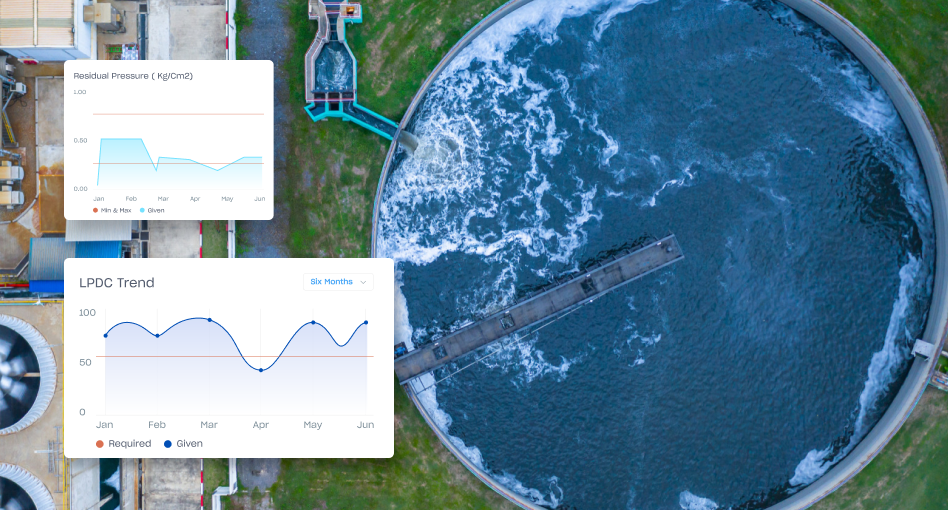
Our team created intuitive Power BI dashboards that presented vital data such as water supply levels in addition to pressure and chlorine monitoring through an easy-to-understand layout that provided real-time updates.
-
Seamless IoT Integration with Azure Cosmos DB
The IoT sensors transmitted data to Azure Cosmos DB where the data management remained flawless despite-growing sensor counts throughout numerous sites. The system produced smooth data processing along with purity and dependability in information delivery.
-
Live Monitoring with Smart Visuals
The best part? The system gave users instant access to real-time viewing of field operations. The system displayed instant alerts about pressure drops and chlorine unbalance through dashboards featuring intelligent visual metrics combined with multi-level investigation features.
Project Glimpse


Key Features
Real-Time Water Monitoring
IoT-Based Data Acquisition
Centralized Data Dashboard
Area-Wise Water Supply Visualization
SLA & KPI Tracking Module
Government Reporting Interface
Interactive Filtering & Drill-Down Tools
Result
-
01.
Real-Time Visibility
Stakeholders benefited from accurate and timely information about daily water supply performance and pressure readings along with chlorine measurements to make quicker, more educated decisions.
-
02.
Improved Monitoring
Through this single platform every level of authority from districts to villages managed to track the performance and systems of their water distribution together.
-
03.
Efficient IoT Device Management
Through this system, users could simplify IoT sensor problem recognition, which led to reduced downtime and enhanced data dependability.
-
04.
Insightful and Actionable Dashboards
Users could analyze data effectively through customizable dashboards that incorporated filtration tools and depth analytics in combination with geographical displays.
Let’s get in touch!
India
SPEC House, Parth Complex, Near Swastik Cross Roads, Navarangpura, Ahmedabad 380009, INDIA.
-
 +91-79-26404031, 32-33-34
 -
 [email protected]
