


Social Media Analytics Dashboard For eCommerce Company
Business Challenges
Robust business intelligence solution that can offer social media insights into how well the interaction is helping the organization in terms of growing its business, meeting targets, connecting with customers/prospects, areas that need improvement, etc.
Visualize and analyze social media metrics, to enable a detailed understanding between the organization and its social media user base
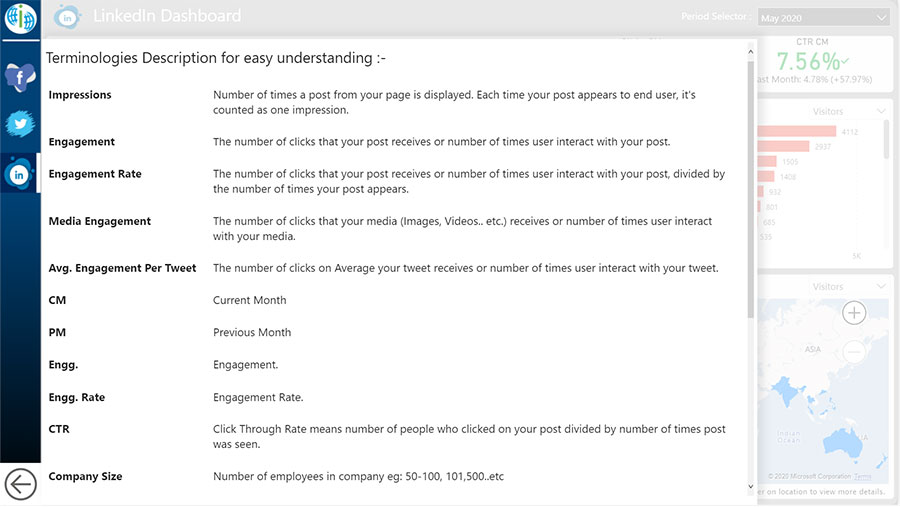
Even while creating visual effects, it would also happen that the end-user may not understand these visualized terminologies
Collect a variety of data from varied social media platforms
Perform analysis on collected bulk of data with multiple terminologies
Technical Solution
Looking at the challenges, SPEC INDIA helped the client by offering them a comprehensive and easy-to-analyze Social Media Dashboard which includes various social media metrics reports.
A social media analytics dashboard aims at extracting value from data based on different social networks over various timeframes. This report is fundamental to explain social media progress and helping gain business insights.
Social Media Dashboard Key Features
Cleansing the data with Power Query and DAX and make a dimension table
Understanding social media terminologies used while creating a dashboard
Drill down feature for more insights in the form of Donut Chart as Tooltip, along with other metrics to discover insights
Showing a variety of information in the form of reports/dashboards like Month-Year wise data, Comparing current vs previous month for important measures such as KPI
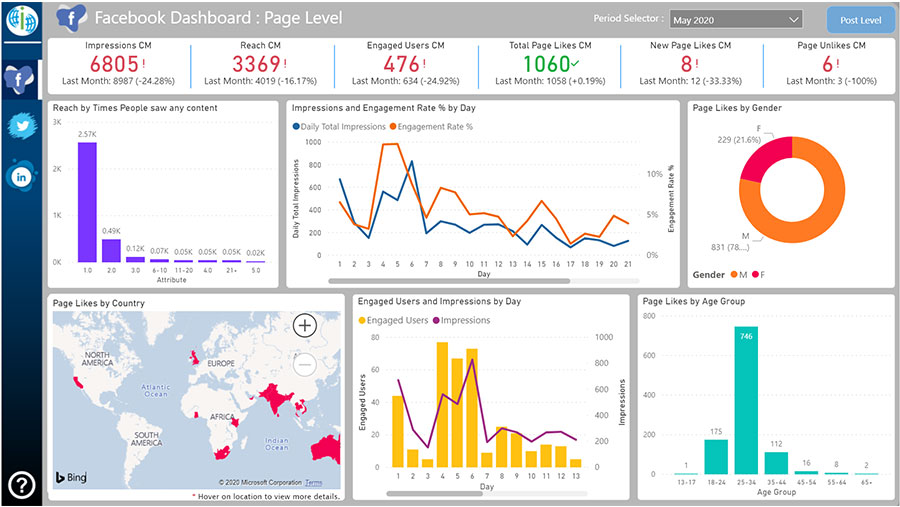
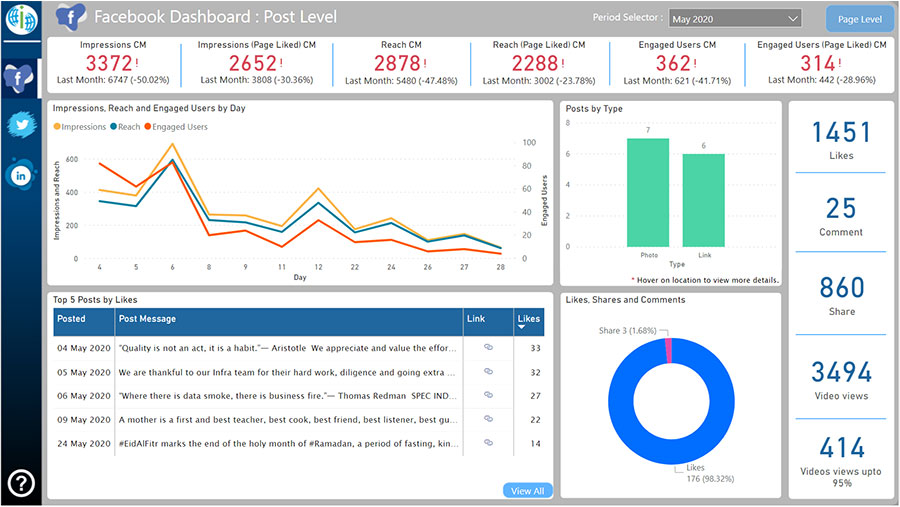
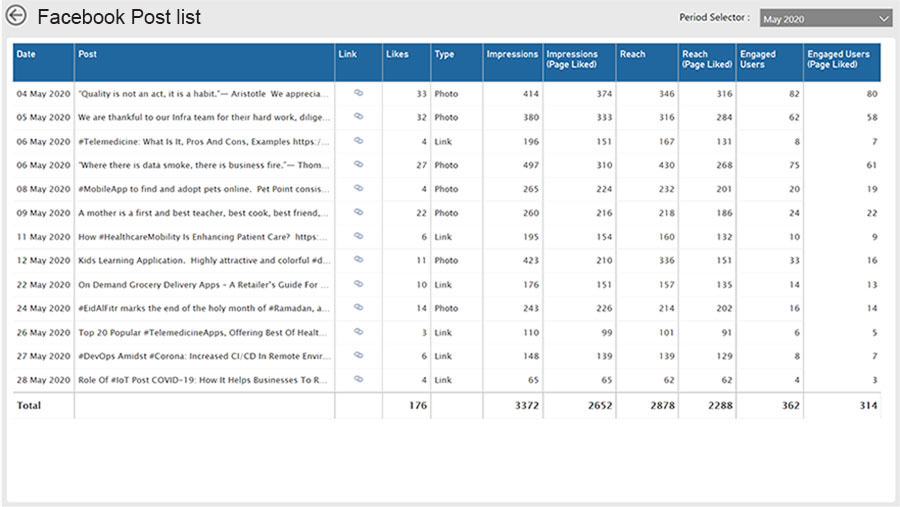
Facebook report that focuses on advertisements/marketing campaigns performance with important metrics to track social media performance like impressions, engagement, engagement rate, CTR (Click Through Rate), reach, etc.
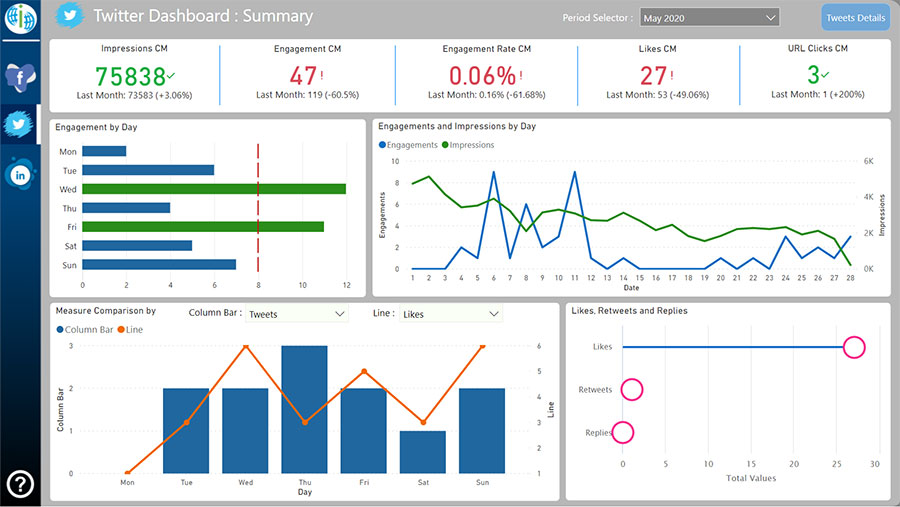
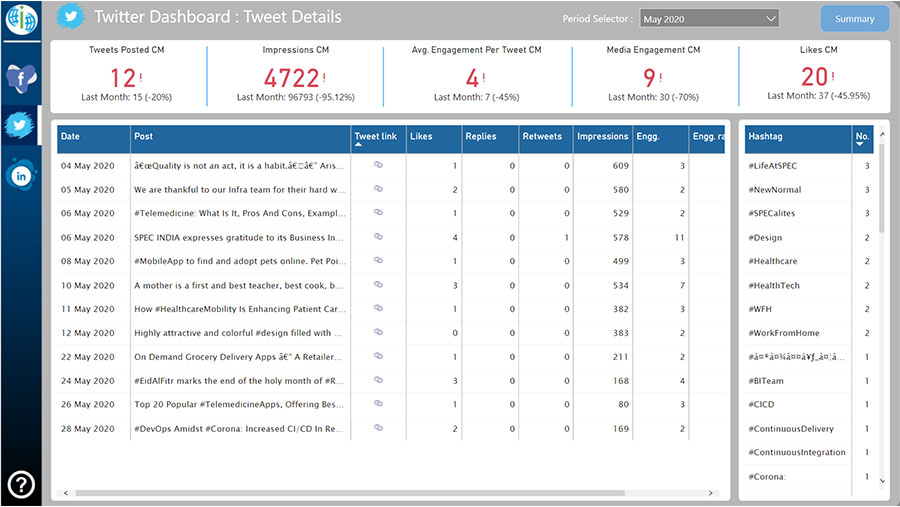
Twitter report that focuses on user engagement with metrics like impressions, engagement, likes, replies, retweets, engagement rate, hashtag used, etc. This report is shown as two sections – summary and tweet.
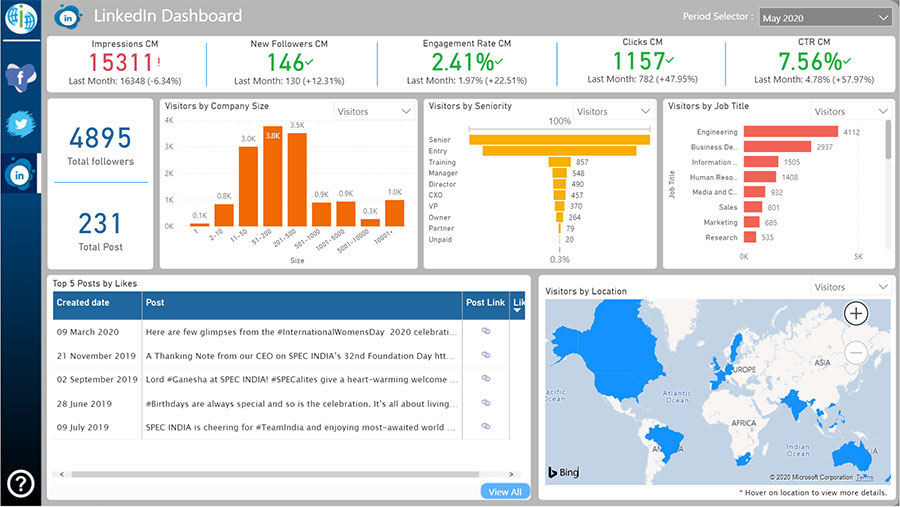
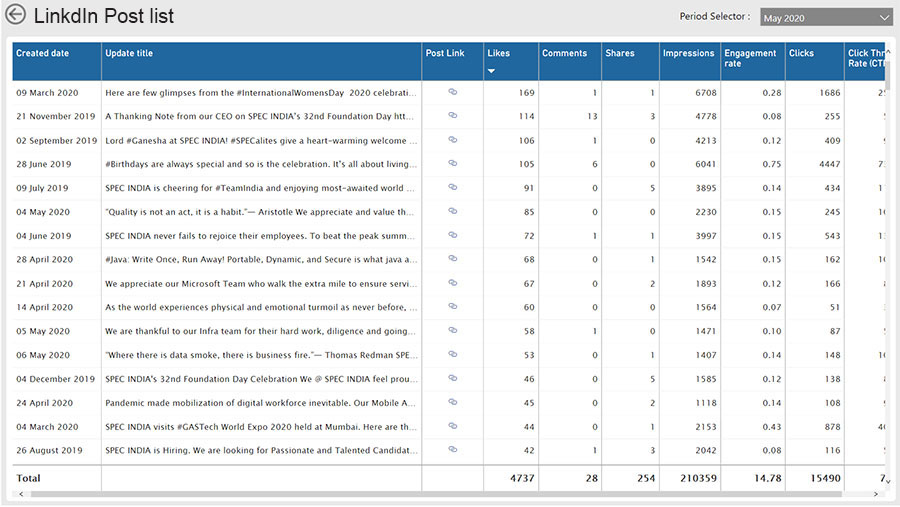
LinkedIn reports show different metrics by followers and visitors, depending upon selection from the dropdown list which user can select from the dropdown to view visual according to it
Screens

Want To Gain Better Social Media Insights For Your Business?
SPEC INDIA’s easy-to-analyze Social Media Dashboard is the solution that your business requires. With it, you can leverage the power of structured data for better business decisions.
Technologies & Tools
Our Process
Research/Analysis
Our detailed and accurate research , analysis, and refinement leads to a comprehensive study that describes the requirements, functions, and roles in a transparent manner.
Design
We have a team of creative design experts who are apt at producing sleek designs of the system components with modernized layouts.
Coding
Our programmers are well versed with latest programming languages, tools, and techniques to effectively interpret the analysis and design into code.

Testing
Quality is at the helm of our projects. We leave no stone unturned in ensuring superior excellence and assurance in all our solutions and services.
Launch
We have a well-defined, robust, and secure launch criteria that offers us a successful implementation clubbed with detailed testing, customer acceptance and satisfaction.
Business Benefits
Social media analytics dashboard/performance reports offer a wealth of information, helping the organization generate more leads and cultivate long-lasting client relationships
Power BI compresses data thereby reducing storage to less than 5% when compared with competing data visualization platforms
Enhanced insights of social media platforms to make optimal decisions in enhancing business and customer base
Strong decision-making to grow or focus on target customer groups and social media platforms that are beneficial to grow business
Reduces report load time and query time to a few minutes and seconds, respectively
Effective and well-optimized reports with rich graphical displays
Let’s get in touch!
India
SPEC House, Parth Complex, Near Swastik Cross Roads, Navarangpura, Ahmedabad 380009, INDIA.
-
 +91-79-26404031, 32-33-34
 -
 [email protected]
