

Travel Data Analytics Solution for a Travel Agency
The client is a business that major in the business of travel and tourism and is situated in the United Kingdom. The client had multiple systems but they were not integrated and they had poor data visibility. This situation made it difficult for them to take decisions and policies involving promotions, marketing and even pricing. We assisted them in the implementation of a business intelligence solution which allowed our client to better analyze their information and make decisions based on that information.
-
Industry
Travel and Tourism -
Country
United Kingdom
Technologies
Years In Business
Projects Delivered
Happy Clients
Countries Served
Business Goals
- The client wanted to integrate their different systems for purposes of presenting a consolidated picture of their business processes.
- They required accurate guidance on the outcome of their promotion and marketing performance, as well as return on investment of marketing campaigns.
- The client wanted to obtain a better insight into current developments in the market as well as price competitiveness within the given field of industry.
Business Challenges
Lack of Unified Data Across Systems
The client had a problem with the company systems where data was isolated by departments and did not integrate with each other. This led to the situation where there was absolutely no synchronization and disconnected information.
Difficulty in Tracking Marketing ROI
There was no single system that was in place which could have made it easy to monitor the return on investment (ROI) for the marketing expenses. The client had no specific view of the best performing campaigns hence unable to distribute the marketing budgets in the best manner.
Limited Insight into Customer Behavior
The absence of a 360-degree view of operations prevented the client from fully understanding customer behavior, preferences, and purchasing patterns. Since they had no coherent and integrated vision of operations, the client did not have an adequate vision of customer’s behaviors, preferences, and purchasing habits.
Inability to Maintain Competitive Pricing
Because of these fragmented systems, the client was struggling to effectively identify market trends and pricing by their competitors. The desired business goal of this challenge was to make it difficult for organizations to adapt their own price structure to the market.
Technical Solution
-
We developed a centralized Data Lake using an ETL (Extract, Transform, Load) process to bring together data from all the client’s systems in one place.
-
We set up a system to automatically collect data from third-party services using REST API calls. This ensured that all external data flowed smoothly into the Data Lake, helping the client access valuable insights without extra manual work.
-
We built a well-structured Data Warehouse to organize the data into clear categories. This made it easier for the client to analyze important information, such as sales, customer trends, and pricing strategies, in a more efficient way.
-
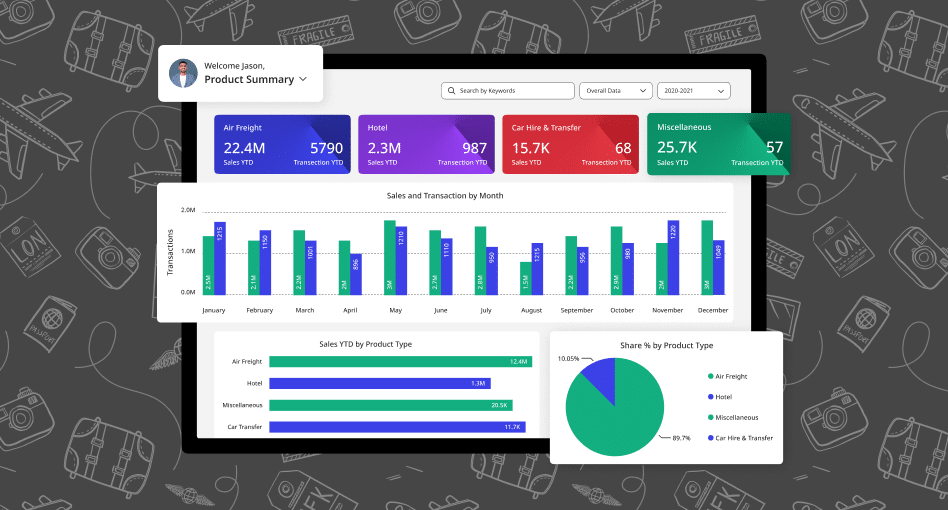
We created detailed and easy-to-read Power BI reports covering key areas like Sales, Refunds, Customer and Route Analysis, and Agent Productivity.
Project Glimpse


Core Features
Centralized Data Repository
Custom Power BI Reporting
Strategic Insight Enhancement
Custom SLA Calculation Module
User-Friendly Data Interface
Results
-
01.
Revenue Growth
Our solution helped the client make data-driven decisions, improving their pricing and promotional strategies, which led to increased revenue.
-
02.
Customer Experience
Data insights enhanced customer retention and loyalty, improving the overall experience for their users.
-
03.
Optimized Reporting
The visually rich, easy-to-use Power BI reports simplified data analysis, making it more efficient and cost-effective.
-
04.
Centralized Access
Centralized data access allowed key users to make faster, better decisions, streamlining their operations.
Let’s get in touch!
India
SPEC House, Parth Complex, Near Swastik Cross Roads, Navarangpura, Ahmedabad 380009, INDIA.
-
 +91-79-26404031, 32-33-34
 -
 [email protected]
