


Visualization Portal for an Enterprise Service Sector

Client’s Business Goals
They were keen to design and develop a business intelligence solution that can analyze the data from Microsoft Dynamics ERP enterprise solution along with details of labor cost, warranty cost, and other service-related costs for better tracking of metrics.
Business Challenges
The client was finding it difficult to visualize different reports based on parameters. They were looking for a business intelligence solution that could gather information from different sources, connect Microsoft Dynamics ERP solution, and map data accordingly.
Our Approach
Looking at the challenges faced by the client, SPEC INDIA followed the T & M model to develop roadmap and architecture of the product. We designed and launched the Power BI reports and dashboards, after identifying and researching on various modern methodologies.
Technical Solution
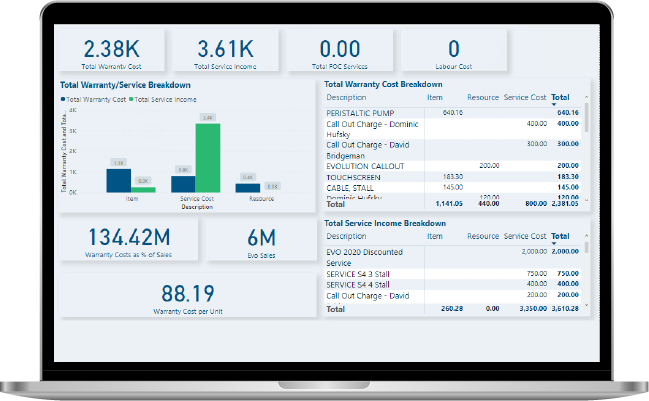
As a project, firstly, we connected the enterprise system data and generated a range of visualizations for tracking different costs and factors related to warranty. We have designed a range of Power BI dashboards and reports to offer insights for different parameters.
We have created a data model in Power BI using the minimal approach. We have leveraged SQL Server to get the data from Microsoft Dynamics ERP and have created specific DAX (Data Analysis Expressions) measures to get the correct output.
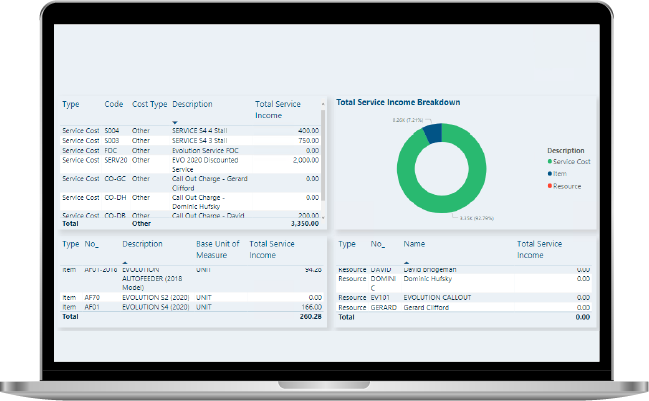
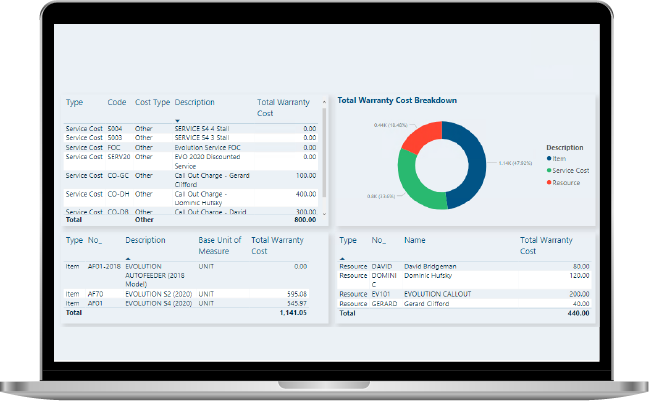
We have created Power BI reports that can give an idea about salesman-wise warranty cost, service income, and sales information with detailed categories to track how much portion is left after all costs.
Key Inclusions
KPIs: Warranty Cost with Breakdown along with Item, Service Cost, and Resource
Service Income with Breakdown
FOC Services
Labour Cost
Sales information with detailed categories
Salesman-wise warranty cost
Warranty Cost Per Unit
Screens

Do You Want To Make Data-Driven Decisions For Your Project?
We have helped a number of global clientele with our analysis and reporting services to drive better performance based on data
Technologies & Tools
Our Process
Research/Analysis
Our detailed and accurate research, analysis, and refinement leads to a comprehensive study that describes the requirements, functions, and roles in a transparent manner.
Design
We have a team of creative design experts who are apt at producing sleek designs of the system components with modernized layouts.
Coding
Our programmers are well versed with latest programming languages, tools, and techniques to effectively interpret the analysis and design into code.

Testing
Quality is at the helm of our projects. We leave no stone unturned in ensuring superior excellence and assurance in all our solutions and services.
Launch
We have well-defined, robust, and secure launch criteria that offer us a successful implementation clubbed with detailed testing, customer acceptance, and satisfaction.
Business Benefits
Easy performance insight of Income Vs Cost
Overview and detailed view of data
Insights in an interactive manner
Faster decision-making on product impact
Increased digitization inputs
Viewing dashboards on an ongoing basis
Let’s get in touch!
India
SPEC House, Parth Complex, Near Swastik Cross Roads, Navarangpura, Ahmedabad 380009, INDIA.
-
 +91-79-26404031, 32-33-34
 -
 [email protected]
