


India
Tableau Prep, Tableau Desktop, Salesforce, Tableau Online
Global Logistics
The project is about developing a business intelligence and analytics application for a leading logistics software technology company dedicated to solving the most challenging last-mile problems in global logistics. They offer a real-world ready dispatch management platform for last-mile excellence.
It helps enterprises transform their logistics operations into growth centers through advanced optimization algorithms and intuitive workflow automation that equip businesses with the tools to maximize efficiency while delighting customers.
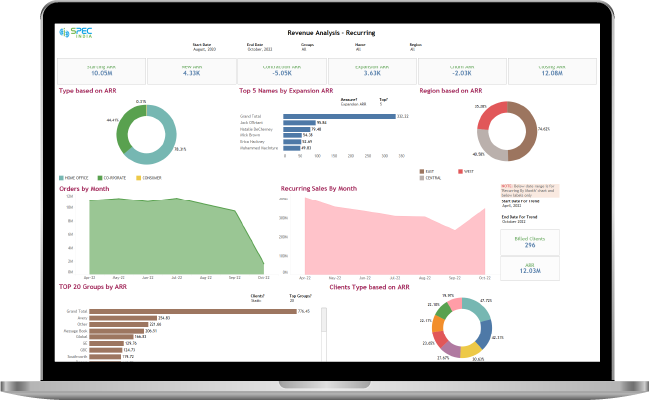
They were keen to design and develop a business intelligence solution with custom dashboards and reports for monitoring different parameters like revenue, billing clients, expense analysis etc. that can help them take accurate business decisions.
The client was finding it difficult to come up with a set of reports and dashboards that were created from multiple data sources. It was difficult to offer navigations based on current users with proper restrictions for first-time users. They had manual data in Excel sheets that was to be replicated and automated in Tableau.
SPEC INDIA understood the requirements and recognized the challenges faced by the client. We offered an end-to-end business intelligence solution with the best of Tableau visualizations to attend to different activities.
Key Components
We implemented logic to show navigations based on current users only for maintaining data privacy. We used Tableau functionality called data blending to connect & combine data from multiple data sources. We implemented custom logic using Table Calculations of Tableau to achieve the visualization desired by the client.
Budget Vs YTD, category-wise, type wise
Performance Marketing ROI
MoM Breakup
Pipeline report analysis
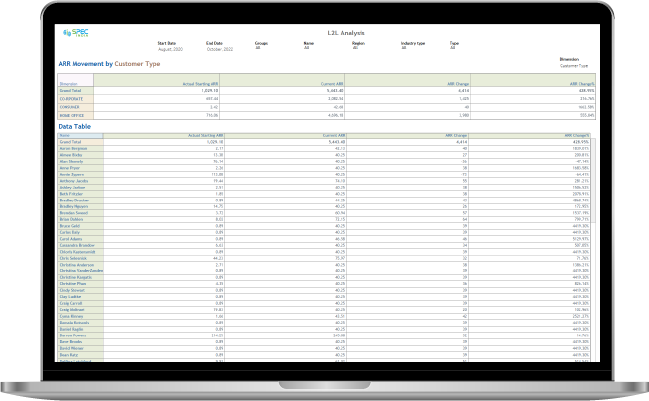
Tech 10x4 analysis
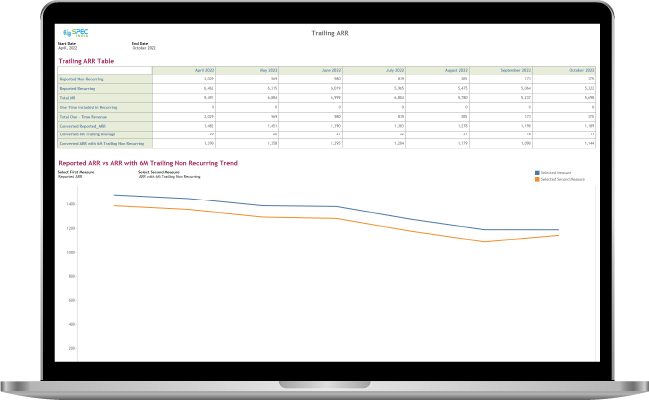
Trailing ARR
Monthly comparison of total amount based on groups, subgroups
Our solution enabled the business to achieve the following benefits:
Easy monthly monitoring of revenue, expense, and clients
Expense distribution can be managed, calculated, and monitored effortlessly
Check the sale amount and number of billing clients using Cohort analysis
Monitor how many opportunities are been lost, won or are in pipeline
Optimal performance of dashboards with complex visualization
User specific, effective, and well-optimized visualization and dashboards
Enriched graphical user interface (GUI)
Determine how much business has been achieved so far as compared to the decided targets
SPEC House, Parth Complex, Near Swastik Cross Roads, Navarangpura, Ahmedabad 380009, INDIA.

This website uses cookies to ensure you get the best experience on our website. Read Spec India’s Privacy Policy