


Visualization and Analytics Portal for Fintech Software Company


Project Overview
The project is about developing a business intelligence and analytics application for a popular fintech software vendor dealing in investment management with due diligence and monitoring of assets and fund managers. They understand and solve client challenges around collecting, aggregating, sharing, and making sense of complex data and suggest appropriate solutions.
They cater to asset allocators, consultants, private equity groups, and asset/fund managers. They are backed by top management professionals working with leading global financial software development companies.
They were keen to design and develop a business intelligence solution that can integrate seamlessly with a huge amount of data and offer an end-to-end set of reports and a dashboard that can show user-specific data visualization.
The client was finding it difficult to come up with a set of reports and dashboard that has complex visualizations, a huge amount of data, and can load easily in optimal time. Getting user-specific data was getting tough along with showing detailed analytics with dynamic parameters passed from web applications using embedded analytics.
SPEC INDIA understood the requirements and recognized the challenges faced by the client. The client offers a flexible and automatic assessment of funds which includes due diligence questionnaire engine, automatic flexible responses, research and reviews management, workflows, and analytics. The client has its own web application as their product in which they have embedded some Tableau analysis to monitor assets and fund managers.
Key Components
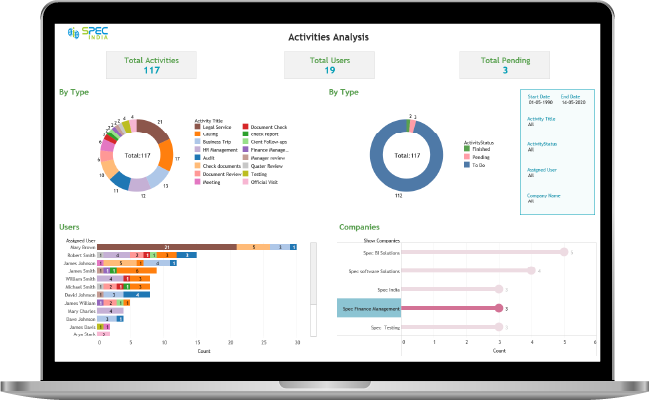
- Dashboards like Activity Tracking Managers reviews and findings dashboard in Tableau, published on Tableau Server and later embedded on client’s web application
- Redirection to another dashboard on click to Chart and opening it within the same webpage using dashboard actions
- Logic to show visualization with the current user’s data only for maintaining data privacy
- Files Dashboard Analysis (by asset, type, manager, month, product, status etc.)
- Findings Analysis (ratings, asset class, status, category, date, Finding type etc.)
- Portfolio Reporting – Findings/Activities
Core Features
We offered an end-to-end business intelligence solution with the best of analytical tools, seamlessly integrating with the client’s web application. Our solution was crafted by leveraging some of the salient features of Tableau. We have used Amazon EC2(Amazon Elastic Compute Cloud) for hosting Tableau Server and Microsoft SQL Server.
Key Inclusions
Performance optimization to increase the performance of all dashboards
Amazon EC2(Amazon Elastic Compute Cloud) for hosting Tableau Server and Microsoft SQL Server
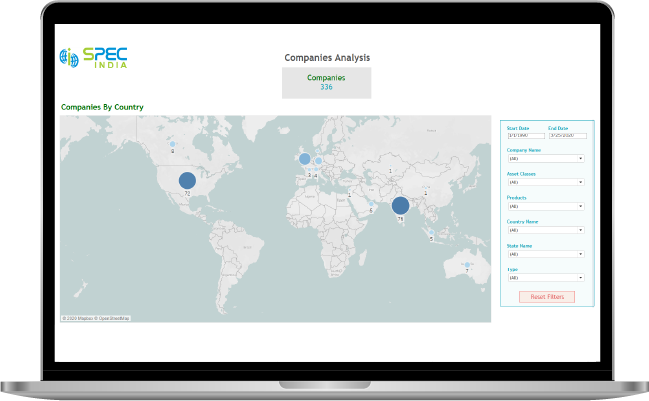
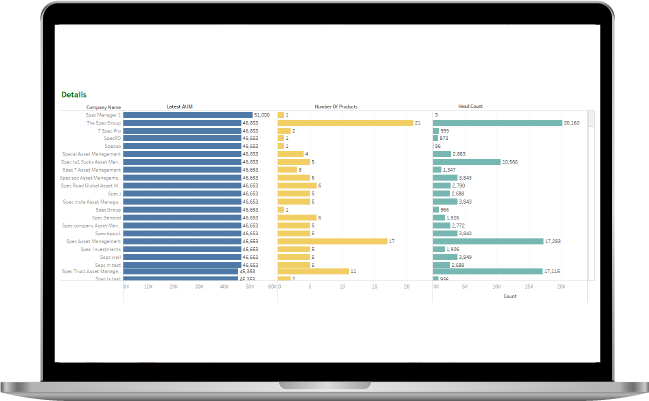
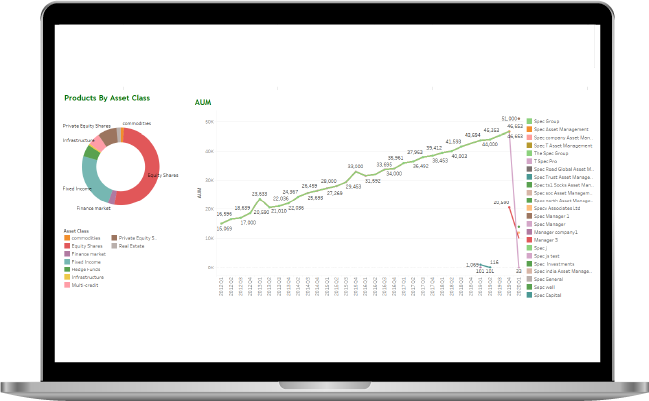
Product Data Analysis
Review Analysis
Screens
Technologies And Platform We Use


Business Benefits
Our solution enabled the business to achieve the following benefits:
Optimal performance of dashboards with complex visualization
User-specific, effective, and well-optimized visualization and dashboards
Enriched graphical user interface (GUI)
Real-time status of assigned activities of users
Maximized efficiency of the assessment process
Efficient monitoring of submission and completion range of questions
Easy to keep track of managers’ progress in various stages of the process
Flexible management of reviews and issues based on criteria
A quick analysis of the manager’s response
Let’s get in touch!
India
SPEC House, Parth Complex, Near Swastik Cross Roads, Navarangpura, Ahmedabad 380009, INDIA.
-
 +91-79-26404031, 32-33-34
 -
 [email protected]