

Improving Java Application Performance: A Developer’s Guide

We tried searching for what users actually faced with Java by searching for “Java app performance issues highlighted by users,” and we landed on a completely different thread. This is a direct call for immediate performance optimization, as failure to address this issue promptly could compromise your business.
Several causes of performance issues include memory leaks, inefficient database calls, bloated frameworks, and unoptimized thread management. These are top-tier causes of degradation in the speed and scalability of Java-backed apps.
As a Java application development company, we have helped businesses transform their sluggish systems into lightning-fast platforms. This blog provides a direct answer to what actually affects Java Performance and outlines the measures to take to boost it.
Why Java Application Performance Matters?
This is the era of AI and real-time applications, where convenience equals speed and prompt responses. Therefore, as an app owner, it becomes your duty to offer a seamless experience. Because this not only drives user satisfaction but also boosts operational efficiency and long-term scalability. On the contrary, if your app performance slips, your competitors win more customers.
Here are reasons to keep a regular audit of app performance:
Increased Infrastructure Cost
Neglecting performance optimization can result in poorly optimized code or inefficient use of CPU, RAM, and server resources. You may invest heavily in infrastructure rather than fixing the issues, resulting in massive cloud bills.
Higher Bounce Rate
One of the main concerns for Java app owners is to hook their app users. Only a high-performing application is the solution to it. If you do not invest in regular optimization, you might face serious consequences, such as poor app reviews, a decreasing user base, or lost conversions.
Poor Scalability
A sluggish app often struggles when the user base grows due to overload. Without proper performance optimization, your application may lag, crash, or bottleneck at events such as payment processing, high-traffic periods, feature launches, or seasonal traffic spikes.
Developer Frustration
When performance issues go undetected or unresolved, your development team ends up firefighting symptoms instead of focusing on innovation. Debugging laggy APIs, tracing memory leaks, or handling downtime eats into productive engineering time.
Not only do the reasons matter for performance optimization, but also the causes should be known so that you can be proactive.
6 Top Causes of Java Application Slowness
No matter how well-built your Java application is, it can still suffer performance issues. Below are six of the most common culprits behind a slow or unresponsive Java system:
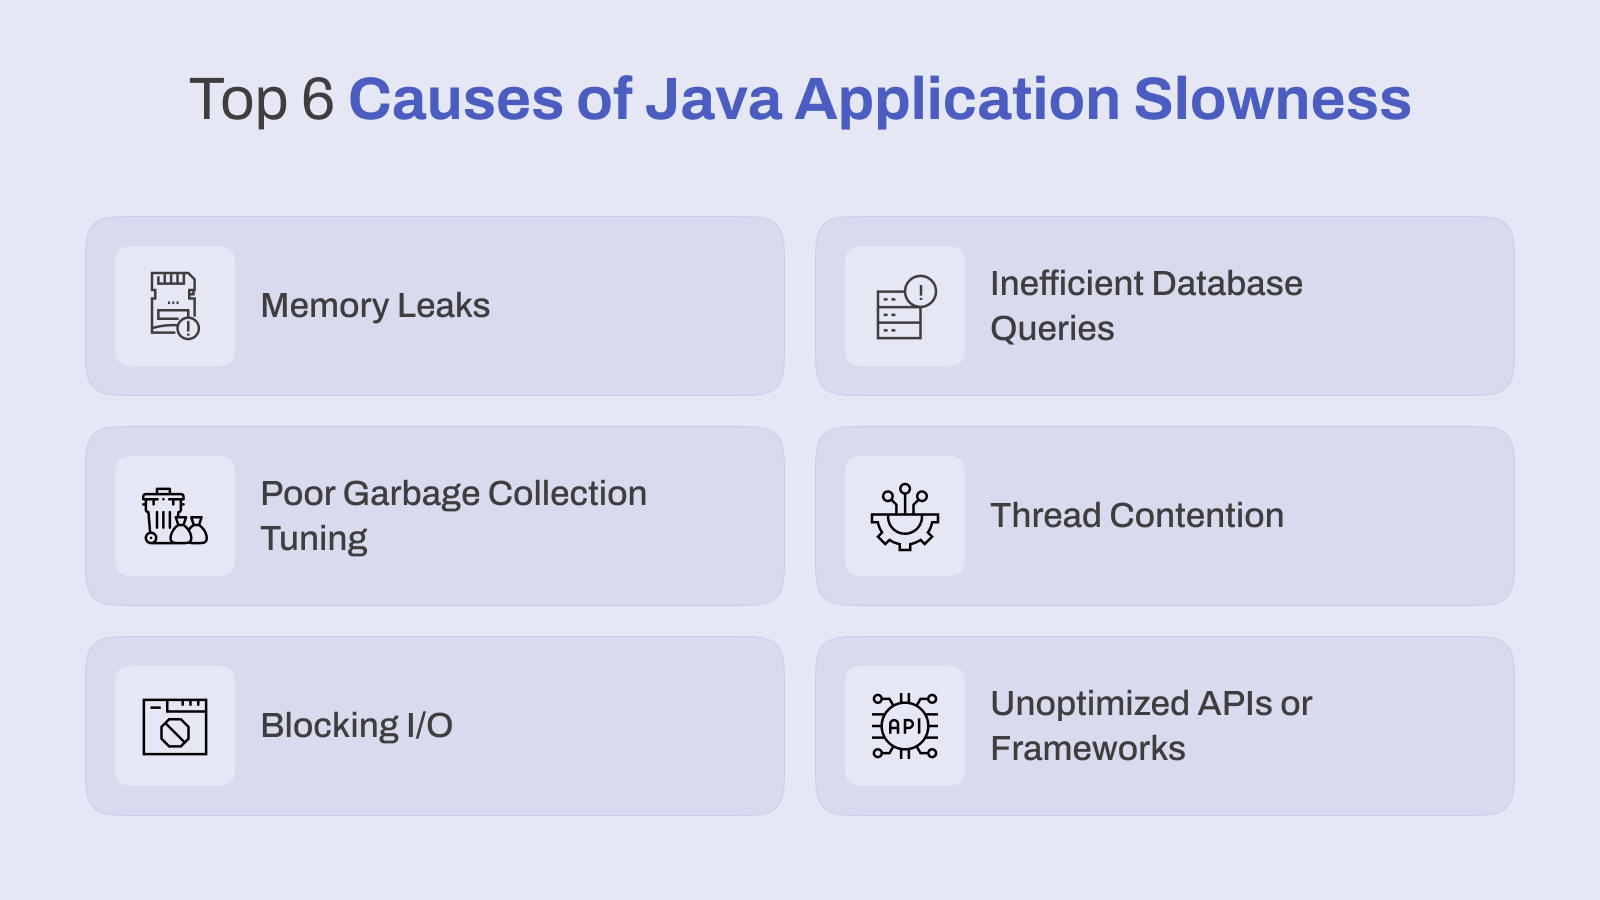
Memory Leaks
Java’s garbage collector ensures memory management, but it won’t guarantee zero memory leaks. It happens when “not required” objects remain in memory, causing it to pile up over time, resulting in increased Garbage Collection activity, degraded performance, and eventually leading to an OutOfMemoryError. Such leaks are difficult to detect unless you are equipped with profiling tools. If the memory leak remains undetected for a longer duration, it can cripple your performance.
Inefficient Database Queries
Database interactions are one of the most frequent sources of latency in Java applications. Poorly written SQL queries, lack of proper indexing, excessive joins, or retrieving more data than necessary can all result in sluggish performance. In ORM-based systems, such as Hibernate, misconfigured fetching strategies (e.g., eager fetching) can silently introduce performance bottlenecks. Without query optimization, even a well-coded app can feel unresponsive.
Thread Contention
Since Java supports multithreading, improper management can often result in poor lock granularity, excessive use of synchronized blocks, and suboptimal utilization of thread pools. As a result of increased thread contention, your application may suffer and experience an operational halt.
Poor Garbage Collection Tuning
Garbage Collection (GC) is crucial for managing memory in Java. However, if there is no fine-tuning at regular intervals, it can cause delays and inconsistent response times. Those systems that are latency-sensitive can be severely hit if complete GC cycles take long pauses across threads. To maintain optimal performance, it is crucial to select the appropriate GC algorithm and adjust its heap sizes accordingly.
Blocking I/O
Another central system operation-hindering cause is blocking I/O. Tasks such as reading from files, waiting for network responses, and accessing remote services fall under blocking I/O, which can freeze threads, leading to sluggish throughput. Such tasks should be duly handled and appropriately buffered, because if there is any glitch, it can cause delays, and the system may start crashing. On the other hand, you can even leverage non-blocking alternatives, such as Java NIO or reactive programming frameworks, which can eliminate the risk of delays.
Unoptimized APIs or Frameworks
Choosing and using the frameworks and APIs directly affects the performance of your application. If the libraries are over-engineered, additional middleware layers are added, or heavyweight frameworks are used, then it can bloat your application and cause it to execute everything slowly.
So, these were the challenges or hurdles that make your Java app slower. To mitigate these risks, we have compiled a complete list of performance optimization strategies. Explore them below and make your Java app lightning fast.
Java Performance Optimization Strategies
Performance tuning is a continuous process because it requires ongoing maintenance of memory management, code efficiency, runtime configurations, and architectural designs. We have compiled effective strategies that help Java apps run flawlessly.
Efficient Memory Management
As a part of optimization, you can make optimum use of memory to ensure your application doesn’t suffer from leaks, bloat, and excessive garbage creation. Some of the key practices include:
- Reutilizing objects in loops instead of recreating them
- Detecting memory leaks using Eclipse MAT and VisualVM
- Avoiding unnecessary object references
- Using appropriate data structures and sizing collections carefully
With brilliant memory handling, the app heap can be kept clean and GC overhead quite minimal.
Thread and Concurrency Management
Java offers multi-threading capabilities that uplift performance. However, without proper control, the same threading can lead to deadlocks and contention. Here is how you can manage threads effectively:
- Minimizing synchronization and shared resource locking
- Track thread activity using tools like JConsole or VisualVM
- Utilizing thread pools instead of creating a new one
- Utilize concurrent collections
A well-managed thread will always ensure swift execution, even under high load.
Database Optimization
Java apps often struggle with databases. However, a few proven strategies fasten up data access, which include:
- Frequent caching enables reading queries
- Running batch operations for bulk inserts/updates
- Avoiding N+1 query issues in an ORM framework like Hibernate
- Implementing connection pooling (e.g., HikariCP)
Use of Lightweight Framework
While frameworks like Spring Boot are popular, not every application needs a heavyweight stack. Lightweight alternatives such as Quarkus or Micronaut offer:
- Faster startup times
- Lower memory consumption
- Better suitability for microservices or serverless functions
Selecting the appropriate framework based on your application’s scale and purpose can significantly enhance runtime performance.
Improve I/O Performance
Blocking I/O operations can severely limit application scalability. You can improve your performance I/O by:
- Using Java NIO for non-blocking file/network operations
- Asynchronous logging (e.g., Log4j2’s AsyncAppender)
- Implementing buffering where applicable
- Leveraging event-driven models for high-concurrency apps
Reducing I/O wait times improves response times and overall throughput.
Profiling and Monitoring Tools
You can’t optimize what you don’t measure. Profiling helps uncover hidden bottlenecks. Recommended tools include:
- Java Flight Recorder: For in-depth JVM diagnostics
- VisualVM: For memory, thread, and CPU profiling
- AppDynamics / New Relic: For real-time performance monitoring
- Prometheus + Grafana: For building custom dashboards and alerts
Routine profiling ensures your app remains healthy as it scales.
Leverage JVM Tuning
JVM tuning involves modifying runtime parameters to match the workload of your Java application. These are the options:
- -Xms and -Xmx to set initial and max heap size
- GC tuning flags (e.g., -XX:+UseG1GC, -XX:MaxGCPauseMillis)
- Thread stack size and direct memory limits
Proper tuning reduces unexpected pauses and stabilizes performance under heavy traffic.
Code-Level Optimizations
Sometimes, it is all about finding a needle in the haystack. A minor bug could even slow down your performance, which can be challenging to identify and resolve. Here is how you can do it:
- Avoid using expensive operations in loops (e.g., string concatenation)
- Use StringBuilder instead of + for string manipulation
- Select efficient algorithms and data structures
- Avoid unnecessary exception handling in normal control flow
- Clean, optimized code can significantly reduce processing time and memory usage.
Implement Caching Strategies
Caching has been proven to reduce redundant computation and database access. Here are the types of caching you can apply:
- In-memory caching (e.g., using ConcurrentHashMap, Ehcache)
- Distributed caching (e.g., Redis, Memcached)
- Result-set or response caching for frequently accessed data
- Time-to-live (TTL) to ensure cache freshness
Proper caching drastically reduces latency and server load, especially for read-heavy applications.
🚀 Optimize Your Java Application Performance
Slow apps hurt productivity. Let our Java experts tune, scale, and speed up your applications.
How to Run Performance Testing & Benchmarking?
Your performance optimization is halfway to offering a seamless user experience. The other half lies in measuring what you have put to use. By performance testing and benchmarking, evaluating Java app performance under expected and unexpected load, and identifying bottlenecks before they affect end users’ expectations.
Here is how to do it right:
Step 1: Determine clear performance metrics
You must start with how your application should be. For example:
- Is it a running application?
- How many transactions should be processed per second?
- How many resources does the app consume under load?
- Check for failure or downtime during the stress test?
- Ensure to gauge the worst-performing requests
Step 2: Select the Right Testing Type
You must also be sure which testing method suits your performance optimization strategy. Here are different types of testing for your information:
- Load testing: replicates expected user traffic to evaluate steady-state performance.
- Stress testing identifies breaking points of the system by overloading.
- Spike testing: traffic is suddenly increased to evaluate performance.
- Endurance testing: checks for system stability over a longer duration
- Scalability testing: measures how performance changes with increased workload
Step 3: Use Trustworthy Performance Testing Tools
Once you determine which testing affects performance, you must also select a suitable tool. For example:
Gatling: ideal for testing APIs with detailed metrics and scenario scripting in Scala
- VisualVM + JFR: fetches real-time insight into JVM memory, threads, and GC behavior during tests.
- Apache JMeter: great for load and stress testing HTTP requests, APIs, and JDBC connections.
- Locust: ideal for distributed load testing
Step 4: Set Up Realistic Scenarios
Ensure that you test your Java app on a larger scale. Observe how testing works:
- Normal user behavior (authentication, browsing, checkout, etc.)
- Peak load expectations
- Concurrent operations on critical endpoints
- Database-heavy workflows
If you put your app in a realistic environment for testing, you will get sure-shot results with accuracy and precision.
Step 5: Evaluate Outcomes & Isolate Bottlenecks
Once you perform testing, analyze results to identify:
- Long GC pauses
- Thread pool exhaustion
- I/O bottlenecks
- Slow database queries
How Can a Java Application Development Company Help?
As a Java application development company, we take several measures to ensure the app architecture remains operational. With our hands-on experience and the ability to diagnose bottlenecks, we have won clients globally across various industries.
Partnering with us means:
In-Depth Performance Audits
We primarily undertake the evaluation of your app’s current state. It includes inspecting thread behavior, memory usage, garbage collection logs, database interactions, and code efficiency. This in-depth audit uncovers the hidden root cause of sluggish performance, poor scalability, and crashes.
Tailored Optimization Strategies
We have expert development engineers who begin by inspecting your application’s current state, evaluating memory usage, thread behavior, garbage collection logs, database interactions, and code efficiency. This holistic audit reveals the underlying root causes of slowness, crashes, or poor scalability.
Tool-Driven Troubleshooting
Every Java application is different, so a one-size-fits-all approach doesn’t work. Our experienced teams design custom performance strategies that align with your goals. Be it reducing latency, handling high user loads, or cutting down infrastructure costs, these strategies span:
- JVM tuning and GC optimization
- Asynchronous processing implementation
- Database refactoring and query tuning
- Framework-level improvements
- Resource scaling and load balancing
Scalable Architecture Consulting
We know how to extract actionable insights using industry-grade tools like Java Flight Recorder, VisualVM, AppDynamics, JProfiler, and Prometheus. These tools enable our Java developers to monitor anomalies in real-time and validate the impact of each optimization.
Dedicated Development & Support Teams
Sometimes, performance issues are deeply rooted in the design of monolithic or legacy systems. Our Java experts can help you modernize your architecture, advising on microservices, API gateway setups, cloud-native deployments, or event-driven models that boost agility and performance at scale.
Conclusion: Build Fast, Scale Smart
A high-performing Java application doesn’t just deliver faster results; it creates better user experiences, reduces operational costs, and unlocks long-term scalability.
From memory management and thread optimization to smarter database queries and JVM tuning, every enhancement you make compounds into a stronger, more resilient product.
Don’t let performance be an afterthought; make it your competitive advantage. And if you’re ready to optimize with confidence, the right Java development partner can take you there.
Frequently Asked Questions
There is no sure-shot solution or proven strategy to improve Java performance. However, some improvements, such as identifying bottlenecks and addressing or eliminating them, could enhance overall performance. It includes optimizing slow databases, fixing memory leaks, making threads efficient, and regularly optimizing code. Once you have the clarity, start by paying attention to garbage collection tuning, better memory management, thread pooling, and query optimization.
You are required to key metrics such as CPU usage, memory consumption, garbage collection behavior, thread activity, and response times. You can use built-in tools like Java Flight Recorder or VisualVM for fundamental insights. You can integrate advanced APM tools, such as AppDynamics, New Relic, or Prometheus, with Grafana for real-time monitoring. The aim is to prepare a dashboard that allows you to detect signs of performance issues proactively.
Some of the most impactful JVM parameters relate to heap memory, garbage collection, and thread management. A few common ones to start with are:
- -Xms and -Xmx: Set the initial and maximum heap size.
- -XX:+UseG1GC: Enables the G1 garbage collector, which works well for most applications.
- -XX:MaxGCPauseMillis: Helps control how long GC pauses last.
- -XX:+HeapDumpOnOutOfMemoryError: Generates a dump file for debugging memory issues.
Not necessarily! Spring Boot is incredibly popular for its ease of use and rich ecosystem. However, it can feel heavy if you are building a lightweight or high-performance microservice and pulling in unnecessary dependencies. With proper tuning, Spring Boot can run relatively efficiently. For performance-critical workloads, lighter frameworks like Micronaut or Quarkus may offer faster startup times and lower memory usage.
SPEC INDIA is your trusted partner for AI-driven software solutions, with proven expertise in digital transformation and innovative technology services. We deliver secure, reliable, and high-quality IT solutions to clients worldwide. As an ISO/IEC 27001:2022 certified company, we follow the highest standards for data security and quality. Our team applies proven project management methods, flexible engagement models, and modern infrastructure to deliver outstanding results. With skilled professionals and years of experience, we turn ideas into impactful solutions that drive business growth.
Table of contents
Delivering Digital Outcomes To Accelerate Growth
Let’s TalkTable of contents
Delivering Digital Outcomes To Accelerate Growth
Let’s Talk


Let’s get in touch!
India
SPEC House, Parth Complex, Near Swastik Cross Roads, Navarangpura, Ahmedabad 380009, INDIA.
-
 +91-79-26404031, 32-33-34
 -
 [email protected]
