

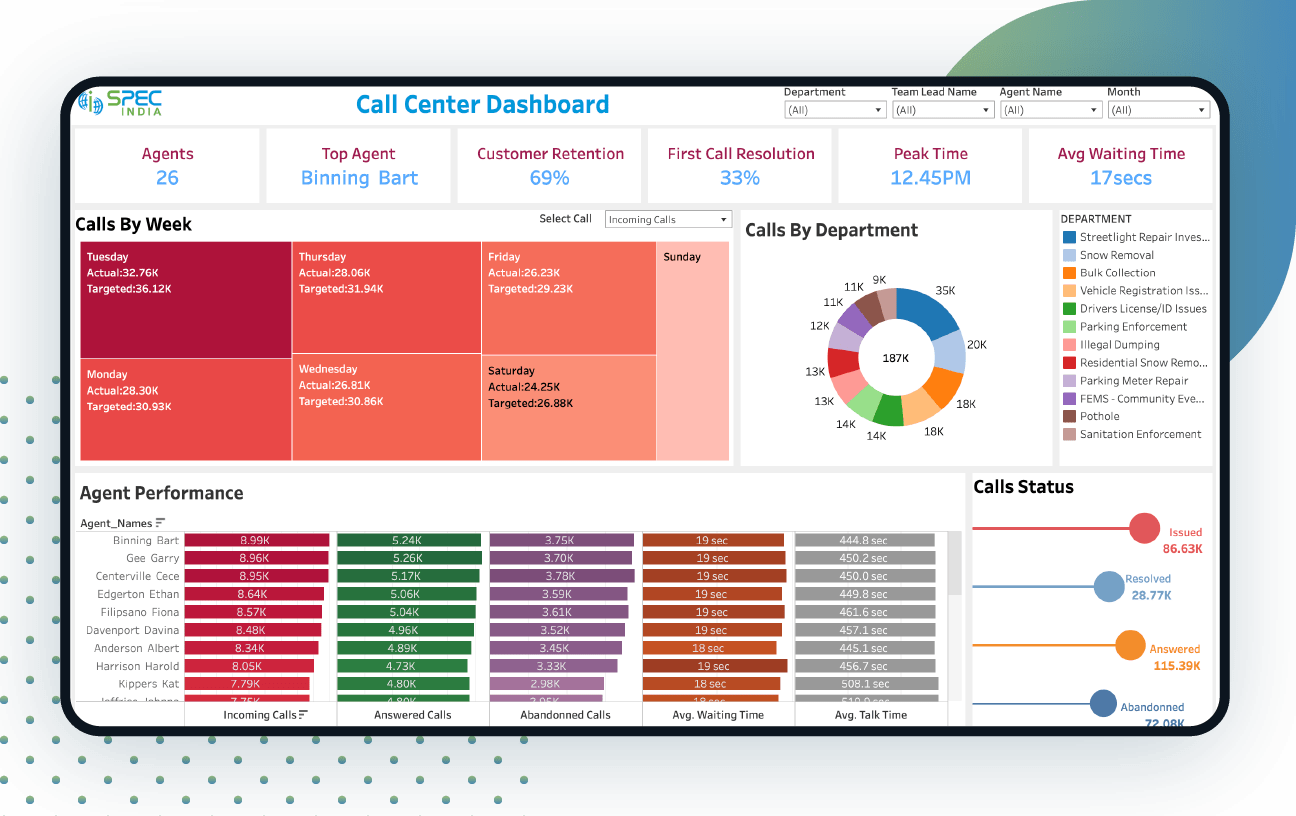
Call Center Dashboard Overview
This dashboard includes the number of agents, top performers, customer retention indicators, calls by different departments, and agent performance along with detailed data of answered calls, incoming calls, average waiting time, and talk time. This dashboard allows managers or authorized team members to monitor and optimize each agent’s performance. This simplifies the analysis and monitoring of any call center by displaying key information in a visually appealing, easy-to-access, and interactive format. This interactive report can be integrated with real-time data sources to monitor current performance including how many calls are issued, resolved, answered, and abandoned. The peak time indicates a time of day where the call center receives the highest number of calls.
A call center dashboard is designed to help improve customer satisfaction and deliver quality services to clients.
Live Call Center Dashboard
Disclaimer: The data, characters and brand names depicted in the visualizations are for demo purposes only. Any resemblance to actual data, or to brand names, is purely coincidental.
Main Features
Real-Time Agent Performance Tracking
Call Analytics and Reporting
Customer Interaction History
Live Call Monitoring
Queue Management System
Agent Status Overview
Customer Satisfaction Scores
Call Resolution Metrics
Workforce Management Tools
Interactive Visualizations and Graphs

Similar Project Idea?
Unleash the Potential of Business Intelligence with our BI Developers Showcasing Technically Superior Skills
Submit RequestGoals
With this call center dashboard, we wanted to make it easier for everyone to improve customer satisfaction and provide great services. Our goal was to give all stakeholders a clear view of how the call center is running and performing, helping them make better decisions for ongoing improvement.
Objectives
Our main objective was to offer an easy to use dashboard for tracking agent performance and key metrics to enhance customer retention.
Use real-time data to quickly identify and resolve call handling issues, improving customer satisfaction.
Help managers analyze call center operations through KPIs for better decision-making and service delivery.
Audience
Call Center Managers and Supervisors
Team Leaders
Customer Service Representatives
Quality Assurance Teams
HR and Training Departments
Operations Managers
Business Analysts
Senior Management and Executives
Customer Experience Teams
KPIs
Total Agents
Top Agent
Customer Retention%
First Call Resolution
Peak time of Calls
Average waiting time
Actual vs Targeted Calls by Days
Total Calls by Department
Incoming vs Answered vs Abandoned vs Waiting Time vs Talk Time by Agents
Total Issued vs Resolved vs Answered vs Abandoned Calls
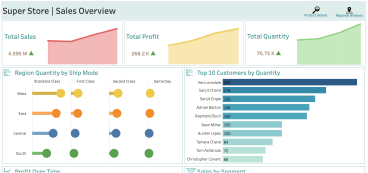
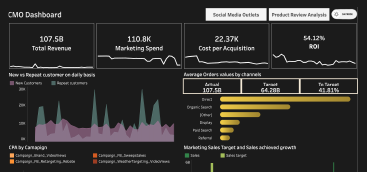
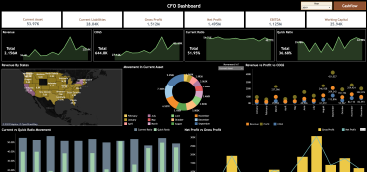
More Live Visualisation


Looking For Something Similar?
We have worked with some of the best innovative ideas and brands in the world across industries.
Contact UsLet’s get in touch!
India
SPEC House, Parth Complex, Near Swastik Cross Roads, Navarangpura, Ahmedabad 380009, INDIA.
-
 +91-79-26404031, 32-33-34
 -
 [email protected]
