One tree
 One life

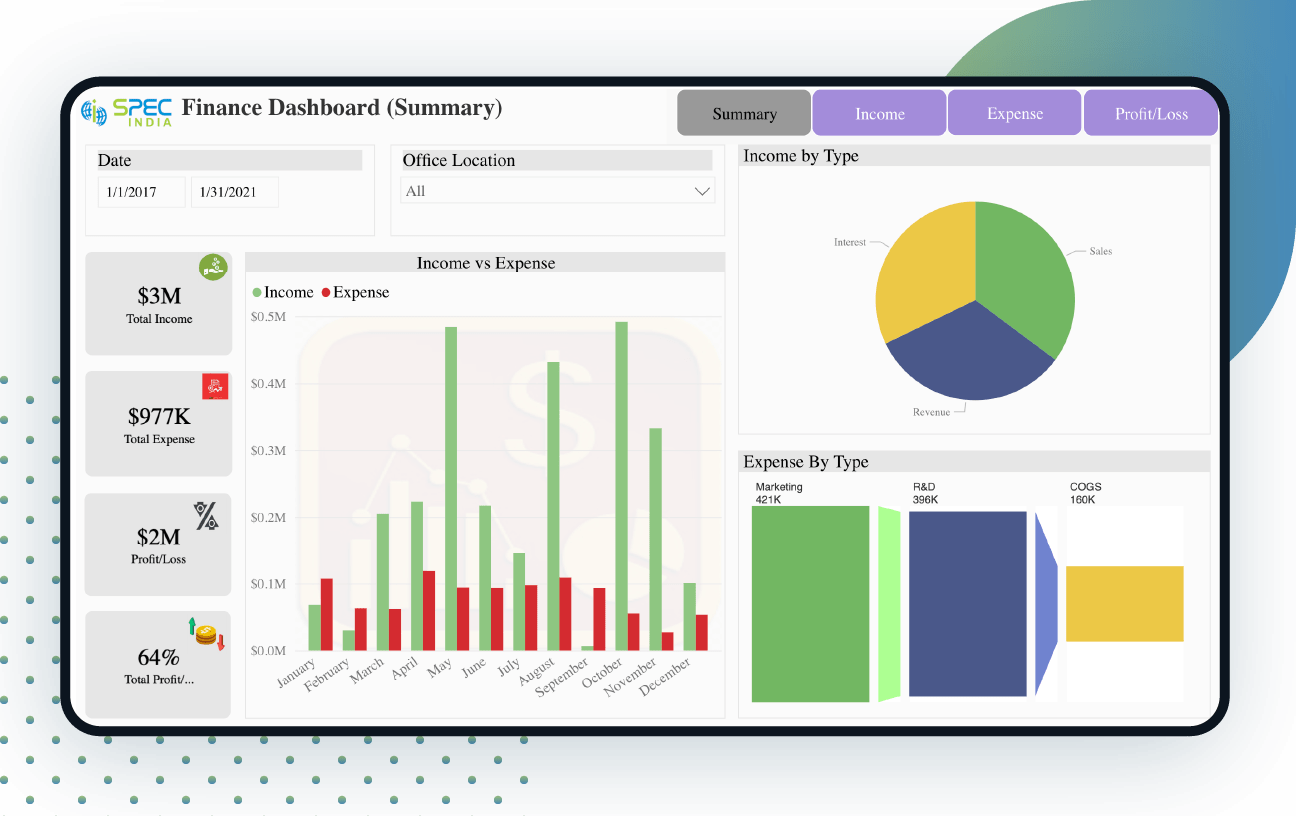
This Power BI financial dashboard was designed for the client dealing with retail store implementation and brand location activation at different shopping environments like airports, border shops, ferries across the world.
This Power BI financial dashboard provides an overall income and expense summary which helps management to identify sources of income and expenses done by various departments of the organization.
With Profit & Loss and Expense reports the decision-makers can track the overall income and expenses that occurred during the year. The MoM and YoY comparison of clients/Projects/Brands will help management to make better business decisions in minimal time and effort.
Disclaimer: The data, characters and brand names depicted in the visualizations are for demo purposes only. Any resemblance to actual data, or to brand names, is purely coincidental.

Unleash the Potential of Power BI with our BI Developers Showcasing Technically Superior Skills
Submit Request

We have worked with some of the best innovative ideas and brands in the world across industries.
Contact Us“SPEC House”, Parth Complex, Near Swastik Cross Roads, Navarangpura, Ahmedabad 380009, INDIA.
“SPEC Partner”, 350 Grove Street, Bridgewater, NJ 08807, United States.
This website uses cookies to ensure you get the best experience on our website. Learn more