

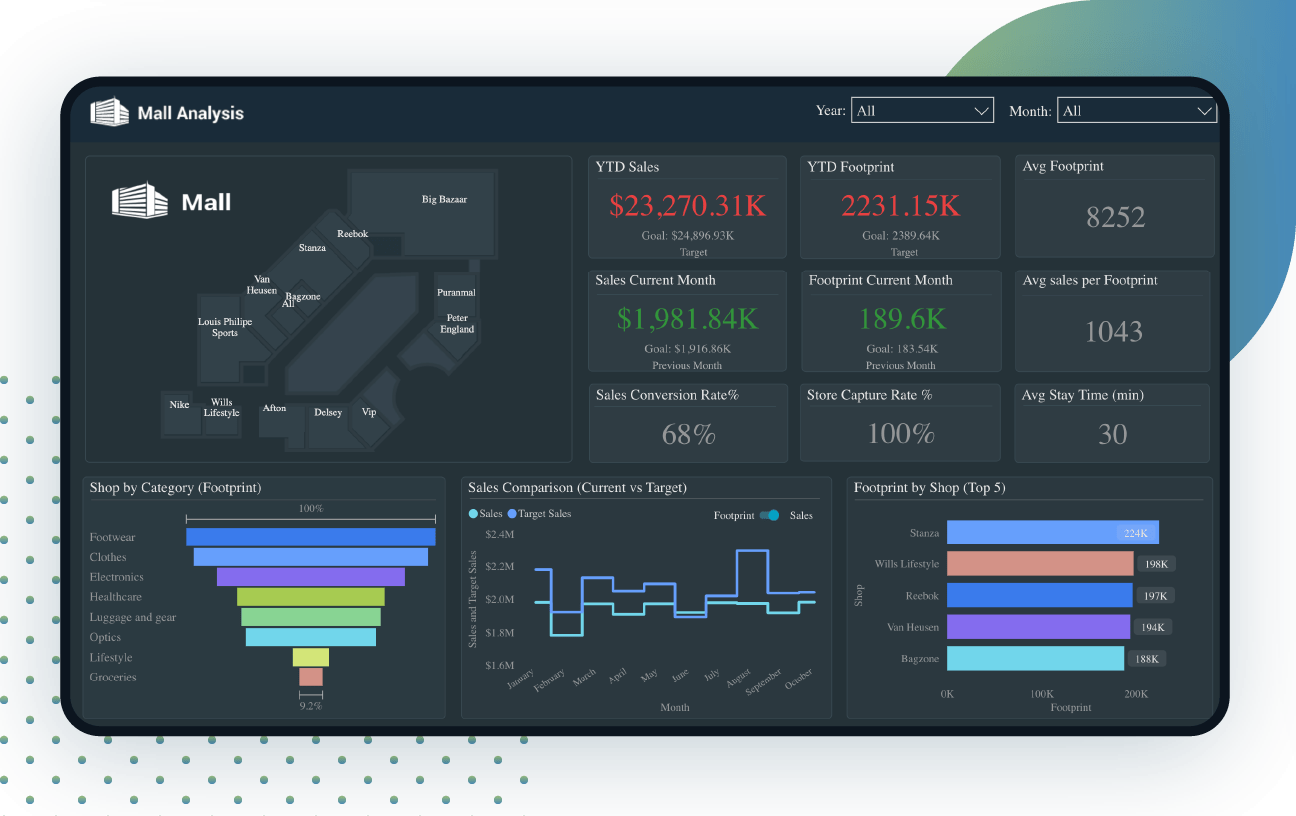
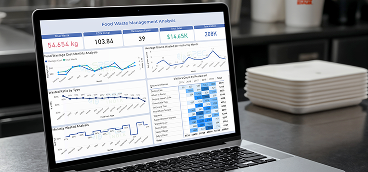
Dashboard Overview
In the Mall analysis dashboard, there are various filters that help you get accurate and precise information regarding sales data and customer visits.
The year and month picker allow fetching data by choosing the year or the respective month. Data can be fetched for any category like footwear, lifestyle, healthcare, etc.
The dashboard also allows tracking the actual sales against the target sales, as well as the actual footprints against the targeted footprints. Comparisons can be made between the current and previous month records to determine the set goals are met or not.
Data can be generated for any individual store just by clicking on the respective store on the map.
Moreover, the dashboard also displays the top five shops or brands having most headcounts and sales respectively.
Live Dashboard
Disclaimer: The data, characters and brand names depicted in the visualizations are for demo purposes only. Any resemblance to actual data, or to brand names, is purely coincidental.
Similar Project Idea?
Unleash the Potential of Business Intelligence with our BI Developers Showcasing Technically Superior Skills
Submit RequestMore Live Visualisation


Looking For Something Similar?
We have worked with some of the best innovative ideas and brands in the world across industries.
Contact UsLet’s get in touch!
India
SPEC House, Parth Complex, Near Swastik Cross Roads, Navarangpura, Ahmedabad 380009, INDIA.
-
 +91-79-26404031, 32-33-34
 -
 [email protected]
