

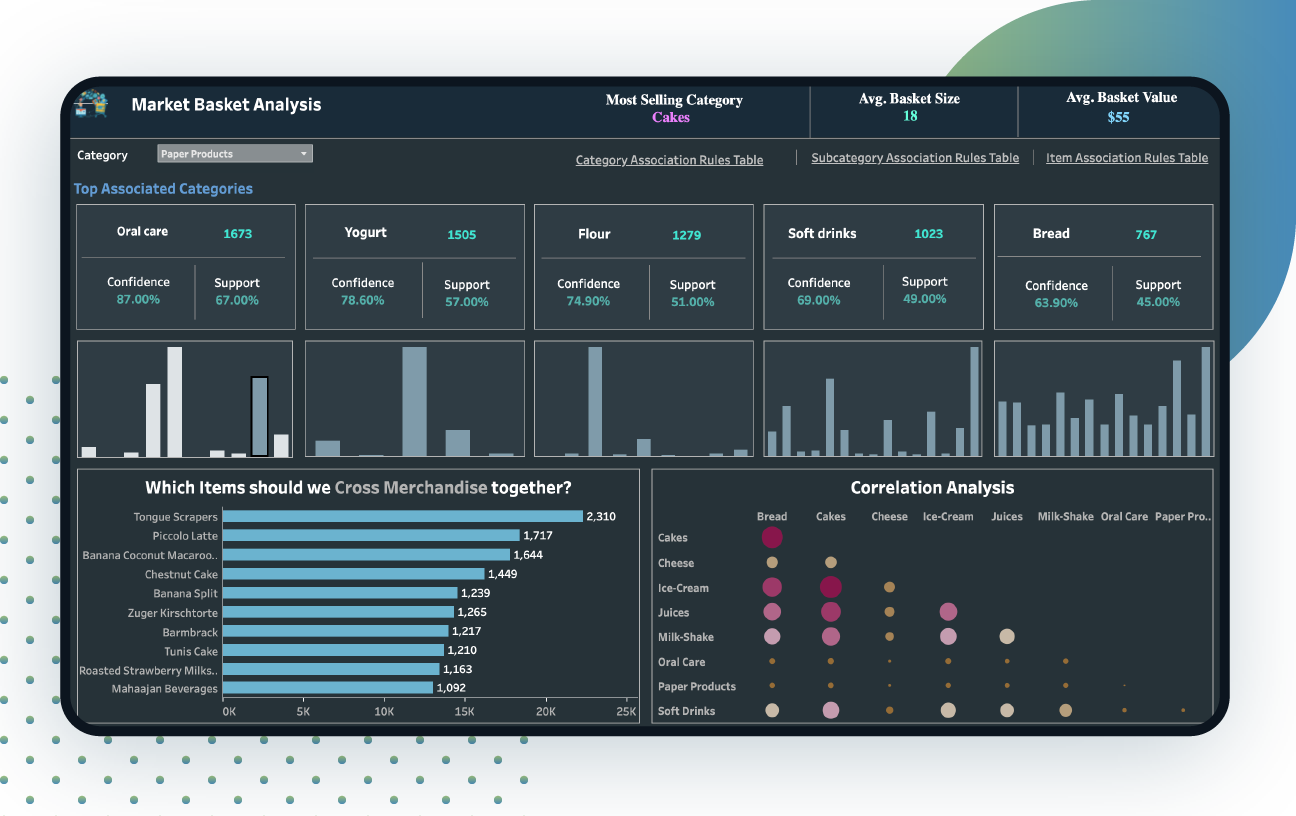
Market Basket Analysis Dashboard Overview
Market Basket Analysis in R for leading supermarket chain. This Predictive Analytics Dashboard represents data in a visual and interactive way which helps to Identify customer buying pattern such as which items are purchased together, or how the purchase of one item influence the customer to buy another item being purchased or one item to avoid the customer to buy another item. It eventually helps the supermarket to explore the ample opportunity which includes but is not limited to Optimize Promotion, Items Multipack, Store planograms, Store Segmentations, Inventory, cross-selling, and many more.
It also provides the association rules for the category, sub-category, and items using cutting-edge machine learning algorithms which helps to optimize marketing strategy in near real-time.
Live Predictive Analytics Dashboard
Disclaimer: The data, characters and brand names depicted in the visualizations are for demo purposes only. Any resemblance to actual data, or to brand names, is purely coincidental.
Main Features
Product Association Insights
Frequent Itemset Identification
Customer Purchase Behavior Prediction
Sales Trend Forecasting
Cross-Selling and Upselling Suggestions
Customer Segmentation Based on Buying Patterns
Transaction Analysis and Reporting
Personalized Product Recommendations
Product Affinity Scores

Similar Project Idea?
Unleash the Potential of Business Intelligence with our BI Developers Showcasing Technically Superior Skills
Submit RequestGoals
The purpose of this dashboard was to aid the store in its awareness of customer behavior towards the products that are being sold. It also addressed inventory issues to ensure that there is sufficient stock for customers to purchase and to avoid excessive stock that will not be sold. Additionally the dashboard also helps them in improving customer service and strategic planning.
Objectives
Customer buying behaviour was examined in detail to enhance inventory control because it was observed that certain products were off the shelves way too often, or there were times when many did not sell at all.
We also found out how some products are consumed together in order to establish how they can be sold together to increase the sale.
Lastly, we provided clear insights into how different product categories are performing. This helped them plan better and use smart cross-selling strategies to increase revenue.
Target Audience
Supermarket Chain Managers
Marketing Teams
Inventory Managers
Product Managers
Retail Consultants
Supply Chain Managers
Business Analysts
Category Managers
KPIs
Top Categories Associated with the selected Category and their supported vs Confidence values.
Correlation analysis of the items.
Items that can be cross merchandise with the selected category.
Association Rules analysis to determine how purchase of one item influence the other item's purchase.
More Live Visualisation


Looking For Something Similar?
We have worked with some of the best innovative ideas and brands in the world across industries.
Contact UsLet’s get in touch!
India
SPEC House, Parth Complex, Near Swastik Cross Roads, Navarangpura, Ahmedabad 380009, INDIA.
-
 +91-79-26404031, 32-33-34
 -
 [email protected]
