 One tree
 One life


UK
Power BI, PostgreSQL, Power Automate, Azure Cloud Services
Oil Industry
The project is about developing a Power BI-based software solution for a popular analyst and trading firm for oil majors that simplifies oil analytics through a user-friendly web platform. It provides oil supply chain and consumption analysis with various data sources. They collect and analyze global crude & energy data and provide insights in form of Daily Market Report and dashboards embedded in the web platforms.
The client has an ever-growing database with all the relevant information in one place. One can navigate the markets with powerful oil market data available anywhere.
They were keen to design and develop a business intelligence solution that can analyze a variety of information related to the oil sector and assist organizations in taking relevant business decisions. They wanted to improve the methods and architecture of their reporting structure.
Our Power BI-based software solution goes by the function and template-based approach to change data from cloud-based and refresh it accordingly. We used Power Automate and relevant utilities for automating activities.
Key Components of Power BI Dashboard
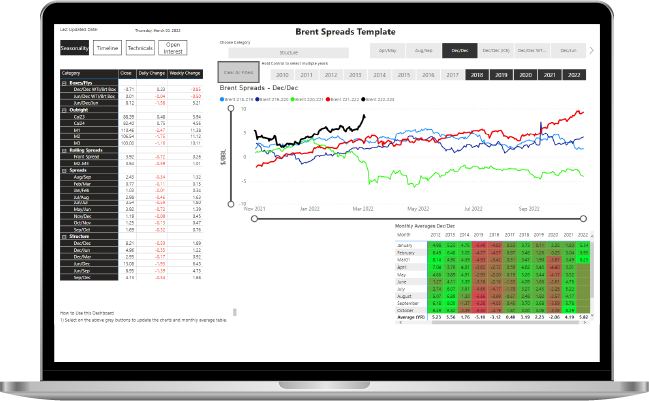
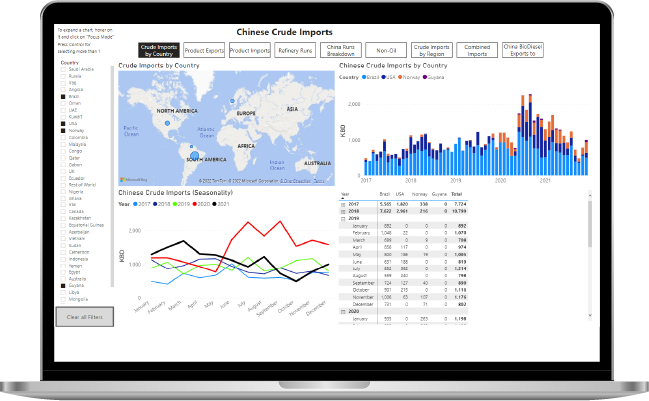
Our team has developed many reports based on requirements of the oil market like RBOB, Brent, Gasoline spreads, timeline charts/tables, future trends etc. We prepared around 35 to 40 Power BI reports and parameters-based reports which helped in faster development and improvisation of their architecture and methods.
Global Crude Imports Data - Daily Open Interest Change, Futures, Spreads, Timeline, Technical like Moving Averages (20 DMA, 50 DMA etc.)
Margin Builders: Europe Margin Builder and Asia Margin Builder to check crude margins dynamically with various scenarios
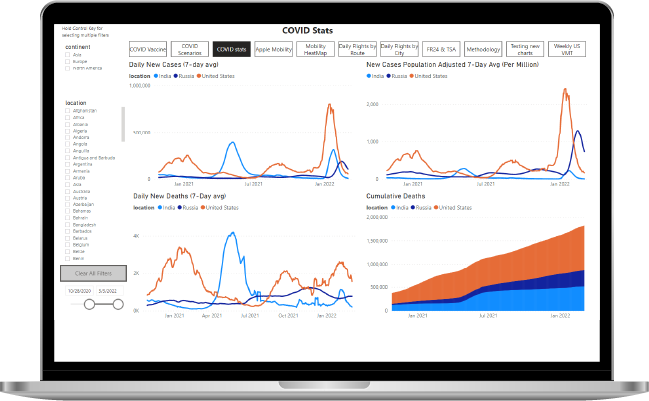
Covid Mobility Power BI Report: It contains COVID data world-wise for vaccinations, cases and along with no. of flights across the world
Energy Dashboard - Various energy sources and its production vs consumption
The business gained the following benefits from our project solution
Oil market insights
Data analytics with machine learning algorithms
Timely, curated, and sharp analysis
Concise and actionable commentary
Ability to download bulk datasets in one click
Least manual intervention
Template based Power BI reports for generating insights
Impact analysis on market trends and patterns
360-degree solution for a complete vision into the global oil market
“SPEC House”, Parth Complex, Near Swastik Cross Roads, Navarangpura, Ahmedabad 380009, INDIA.
“SPEC Partner”, 350 Grove Street, Bridgewater, NJ 08807, United States.
This website uses cookies to ensure you get the best experience on our website. Learn more

