

Sales Analytics Dashboard Overview
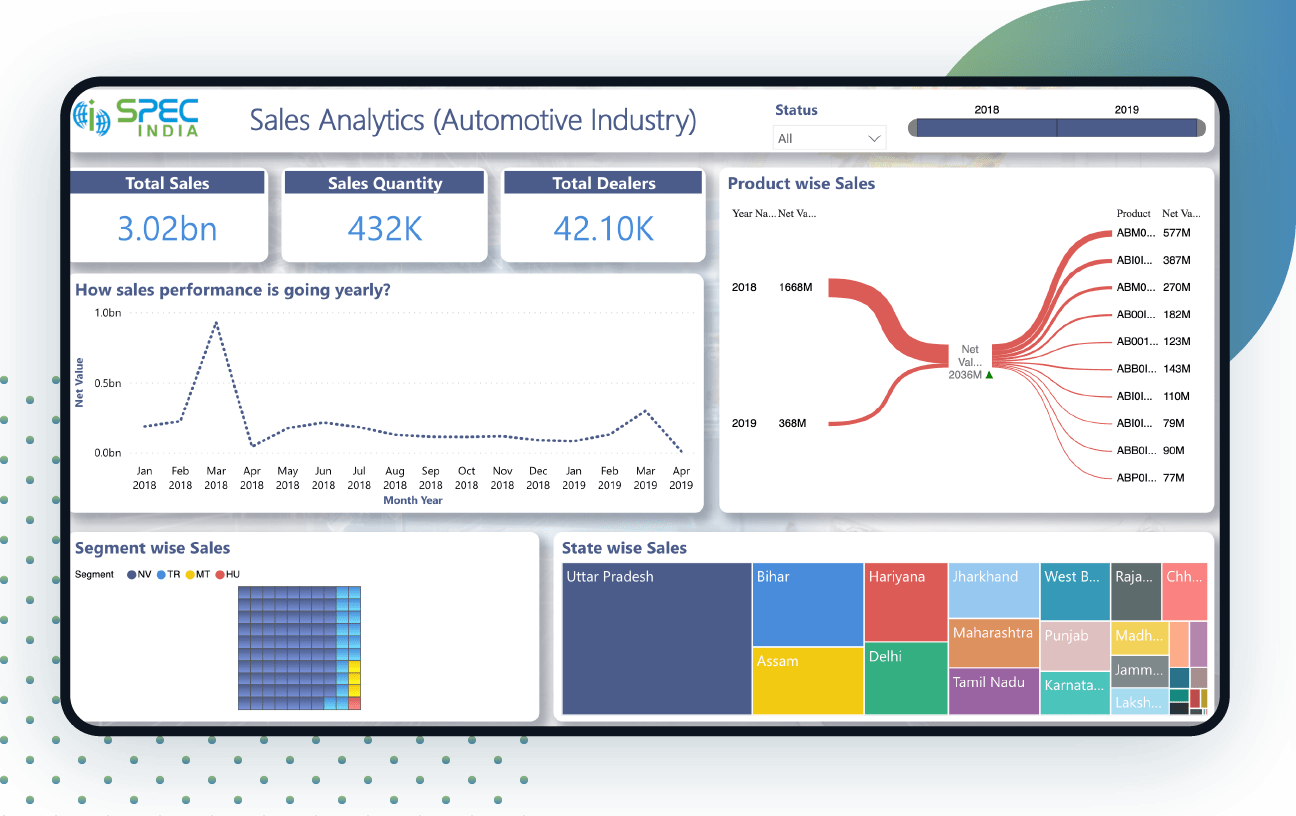
A centralized Power BI sales dashboard analyzing the overall data was developed. To transform the enterprise data into rich visuals the reports were integrated. Data could be easily imported from spreadsheets to visuals and various filters were added to view relevant data. Apart from this, the slicing and dicing allowed the data to be presented in new and diverse perspectives providing a closer view to analytics.
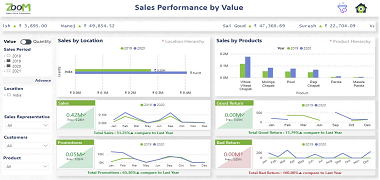
Suitable For: With summarised sales data for various categories, this sales analytics dashboard is useful for management and sales leaders.
Focus metrics: Primary and Secondary Sales by Period, Segments, and Brand. Top 10 Primary and Secondary Sales by Dealer Name, Partner Name, Product Code, and Dealer Area. Moreover, reports also focus on Monthly and yearly tracking, and inventory valuation by sector, and center area.
Use Case: This Power BI sales dashboard provides accurate sales data and information that can be used by management and sales leaders to make better business decisions in a quick time.
Live Sales Analytics Dashboard
Disclaimer: The data, characters and brand names depicted in the visualizations are for demo purposes only. Any resemblance to actual data, or to brand names, is purely coincidental.

Looking for a Similar Power BI Sales Dashboard?
Unleash the Potential of Business Intelligence with our BI Developers Showcasing Technically Superior Skills
Submit RequestMore Live Visualisation


Looking For Something Similar?
We have worked with some of the best innovative ideas and brands in the world across industries.
Contact UsLet’s get in touch!
India
SPEC House, Parth Complex, Near Swastik Cross Roads, Navarangpura, Ahmedabad 380009, INDIA.
-
 +91-79-26404031, 32-33-34
 -
 [email protected]
