One tree
 One life


From data to insight to action – we help the business to transform the way they use data. Our broad expertise in business intelligence tools and big data analytics helps you make the most of the data to generate information and insights that impact business performance. Tableau is a powerful, end-to-end, secure, and scalable business intelligence and analytics platform that makes brands rethink their data strategies.


Combining years of experience in business intelligence services and a diverse BI portfolio, we put data to work using modern technologies and platforms. Our Tableau expertise enables us to address your data requirements by setting up a complete data pipeline along with analytics, reporting, and visualization facilities.
With Tableau Analytics, ask questions and identify patterns with easy-to-use and visually appealing interfaces to generate insights based on your data.

Our Tableau designers and developers make the best use of Tableau’s interactive, advanced, and visual interfaces for pictorial and graphical representation of data.
Integrate all data from different data sources and models easily and quickly to perform advanced analytics and visualization.
Our Tableau consulting services help you to create a roadmap of data by carefully understanding your data flow and needs.
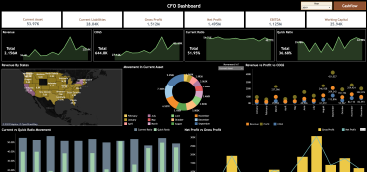
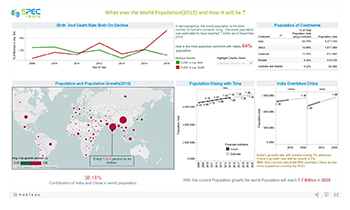
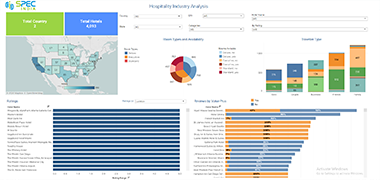
Discover trends, patterns, and performance indicators using visual elements like charts, graphs, and maps with Tableau Visualization.

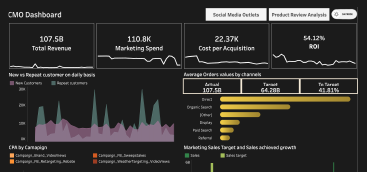
Our Tableau designers design customized and easily accessible dashboards to display information, KPIs, and structured, analyzed data.

Turn your data into insights that can help you grow your business with Tableau Consulting, Visualization, Reporting, Analytics, And Dashboard.
SPEC INDIA’s Tableau Analytics services are aimed at building a data strategy that covers full-cycle data management, data analytics, and data visualization services to make the most of your data assets.
Business intelligence provides organizations with the ability to see data from various perspectives. With detailed reports and dashboards on customer service, staffing, sales, and operations, business intelligence software collect real-time data to be analyzed, interpreted, and used in decision-making.
Business Intelligence tools collect data from multiple resources and monitor key performance indicators that offer a holistic view of your business. With powerful analytics and self-service BI, even non-technical users can interact with data and gain actionable insights to make informed decisions, quickly and safely.
Data is an important asset for businesses. BI helps create a data-driven culture based on company-specific metrics and measures to make faster, more accurate, and rational decisions. Using business intelligence analytics, organizations can make data-driven decisions backed by factual and real-time information.
Visual representation of data is easy to digest and interpret. Business intelligence reporting enables companies to see all key performance indicators on a single page. BI tools deliver fast and accurate information with current, historical, and predictive views to make timely, faster, and smarter decisions.
With powerful data visualization tools, businesses can spot trends, identify opportunities/risks, and get insights into the inefficient process and underperforming departments. This will help businesses to take action for resource optimizations and innovate new programs to accelerate growth.
Data helps organizations track business performance, get a 360-degree-view, and create a strategic roadmap based on all data sources. Business intelligence help businesses keep up with the industry trends, deliver superior customer experience, and increase growth.
Hire a Tableau expert to utilize the data in the most efficient way. Our certified Tableau experts analyze the data to develop a clear strategy for your business's success.
Get in Touch
Discover the diverse range of industries we proudly support with our innovative software solutions to companies of different business verticals. Our expertise spans multiple sectors, ensuring tailored services for every unique need.
It is a self-service embedded analytics solution that is easy to integrate, customize, and use. It lets you create powerful and data-rich dashboards to bring data to life.
Tableau Server is an online hosting platform to host and holds all the tableau workbooks, data sources, and dashboards. It allows users to create, edit, share and collaborate on Tableau Dashboards.
DATEDIFF() function is used to calculate the difference between two dates in Tableau.
Tableau allows connection to a number of data sources such as MS Excel, text files, PDFs, and JSON. Tableau can connect to databases and servers like Tableau Server, MySQL Server, Microsoft SQL Server, and so on.
Tableau offers many certifications. You can take the help of Tableau’s learning resources to become Tableau certified. One of the primary things you require is to have basic knowledge of data blending, data integration, and business intelligence.
To delete a dashboard in Tableau, you need to go to edit mode, click on the Actions menu on the top, and select delete. You need to click Delete in the confirmation dialogue.
To add images in the Tableau dashboard, you can use the Image object. You can make adjustments to the image (Edit, Select, Center, Fix or Edit Height).
When you work with Excel, .pdf, text files, and Google Sheets, you can pivot your data from a crosstab format into a columnar format. You can pivot the data by selecting two or more columns and then selecting Pivot from the drop-down arrow next to the column name.
“SPEC House”, Parth Complex, Near Swastik Cross Roads, Navarangpura, Ahmedabad 380009, INDIA.
“SPEC Partner”, 350 Grove Street, Bridgewater, NJ 08807, United States.
This website uses cookies to ensure you get the best experience on our website. Learn more
 Healthcare
 Fitness
 Finance
 Education
 Media & Entertainment
 Energy & Utilities
 Supply Chain & Logistics
 Travel and Hospitality