


Optimize Your Data Strategy with Power BI Consulting Services
Data drives today’s digital-driven businesses and is considered an asset to strengthening a data-driven decision-making process. Our business intelligence services, including Microsoft’s Power BI, a powerful business analytics tool, offer a platform to collect, analyze, and visualize data through attractive visualization and interactive reports, empowering businesses to boost profitability and uncover insights. Our team helps clients smoothly implement Microsoft Power BI tool by providing the expert consulting and support services.
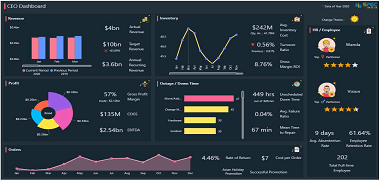
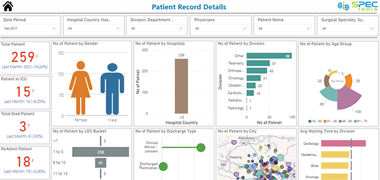
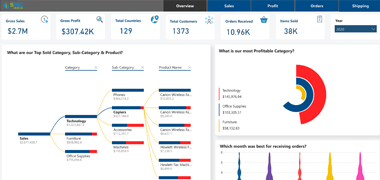
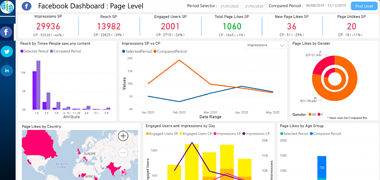
Power BI Reports & Dashboards
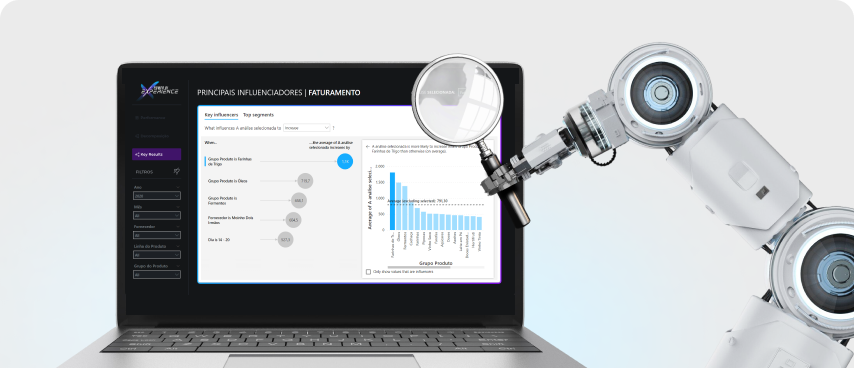
Get dashboards and reports telling a credible tale with SPEC INDIA. Hire Power BI developers to develop integrative dashboards or custom/pre-built visuals aligning with your data visualization requirements. We specialize in Power BI dashboard development, turning complex data into interactive and visually compelling dashboards. Our solutions help you monitor, analyze, and share critical insights in real time for better decision-making. We also create paginated, embedded, enterprise-wide, or ad hoc reports to provide valuable insights.
Power BI Advanced Analytics
Steer exponential business growth with analytical methodologies filtering data noise. Hire Power BI developers to achieve advanced analytics in Power BI. We provide power bi analytics services which includes predictive analysis, data modeling, quick insights, or real-time data analytics.
Power BI Strategy & Consultation
We have skilled power BI developers who craft proven data analysis strategies after realizing your unique data visual requirements to enable your business to have access to required data insights through reports and interactive dashboards for achieving long-term business goals.
Power BI Migration Services
Hire Power BI developers to get assuring of seamless transfer of business data from various business intelligence tools to Power BI without any data corruption or loss of data. Our Power BI developers would make sure that the data visualization is aligned with your requirements after migration.
Power BI Implementation
Our highly skilled Power BI developers plan, create, implement, and fine-tune Power BI solutions without impacting your current business analytics logic. We also ensure that the matrices are customized to deliver desired data visualization requirements to drive a tangible data analytics experience.
Microsoft Power BI Integration Services
Our Power BI developers provide a single view for all crucial data to the user by retrieving the unstructured data from multiple discrete sources for ease to get valuable data insights for the users. Further, we integrate these data analytics solutions in your existing apps or software.
Dedicated Power BI Consultants
Extend your team with experienced, passion, and talent by hiring Power BI developers from SPEC INDIA aligned with your time zone. Our team of dedicated power BI developers is apt to craft robust data analytics solutions aligned with your business growth objectives.
Power BI Customization
Meet each user or business objective of data visualization and analytics with custom interactive dashboards. Hire Power BI developers to get a customized, detailed single view of your business insights for your managerial users. We enable businesses to make informed decisions through custom visuals.

Talk To Our Microsoft Business Intelligence Consultant To Get A 360-degree View Of Your Business
SPEC India is one of the leading Power BI services companies. It helps today’s modern businesses prepare for tomorrow by harnessing the power of data.
Our Power BI Consultant helps develop data-driven strategies that supply insights into critical areas, support your decision-making process, identify emerging trends, and unlock data’s hidden potential.
We Are Among The Leading Power BI Consultants
100+
Projects Delivered11+
Industries Served8+
Average Resource Experience35+
Countries Served7
Clients of 8+ years4.8/5
Customer RatingsWhy Choose SPEC India for Power BI Consulting Services
Turn your data into a powerful asset with our team of seasoned developers. With years of expertise in providing Microsoft power BI consulting services, we have helped businesses to transform their scattered data into clear, actionable insights. From seamless implementation to tailored customization we ensure Power BI works exactly the way your business needs.
Tailored Power BI Solutions01
We design and develop customized Power BI dashboards, reports, and analytics that align with your business objectives. Our solutions provide real-time insights, making data-driven decisions easier and more effective.
Expert Data Integration02
Our team seamlessly integrates Power BI with diverse data sources, including cloud platforms, on-premises databases, and third-party applications. This ensures a unified view of business data for better analysis and reporting.
Advanced Analytics & AI Capabilities03
We enhance Power BI implementations with advanced analytics, AI-driven insights, and machine learning models. These capabilities help businesses uncover trends, predict outcomes, and make proactive decisions.
Global Footprint04
With a strong presence in 40+ countries, we take great pride in serving and supporting clients worldwide. Our global reach allows us to eliminate time zone barriers, ensuring seamless collaboration and uninterrupted service, no matter where our customers are located.
Comprehensive Training & Ongoing Support05
We provide hands-on training sessions and continuous support to help teams fully leverage Power BI. Our support services include troubleshooting, performance tuning, and feature enhancements to ensure seamless operations.
Industry-Specific Expertise06
With extensive experience across industries like retail, healthcare, manufacturing, and finance, we build Power BI solutions that cater to industry-specific requirements. Our domain expertise ensures that businesses get insights tailored to their operational needs.
Empower Your Business with Microsoft Power BI Consulting Services
Get customized Power BI solutions to streamline reporting, integrate data sources, and gain real-time insights. Our expert developers ensure seamless implementation and optimization for better decision-making.
Hire a Power BI Developer
How Power BI Services Can Help You Digitalize Your Business

We help businesses unlock the power of real-time data with interactive Power BI dashboards. Our solutions make it easy for teams to track key metrics, spot trends, and monitor operations with live data updates. This allows your team to act faster, improve efficiency, and make smarter decisions. With instant insights, businesses stay agile and responsive. We make sure even C-suite leaders get a clear, up-to-the-minute view of business performance.
Manual reporting can be slow, repetitive, and full of errors — we change that. With our Power BI solutions, we automate the entire reporting process for you. From data collection to real-time visualization, everything runs smoothly and effortlessly. You get accurate, always up-to-date reports without the manual effort. This means your team spends less time compiling data and more time making impactful decisions based on real insights.

We know that handling data scattered across different platforms can be challenging. Our Power BI integration services bring all your data together — whether it's from cloud platforms, on-premises systems, or third-party applications. We give you a single, unified view of your business. No more data silos, no more confusion. With all your important information in one place, your teams can collaborate better and make more confident, data-driven decisions.

We bring the power of AI and machine learning directly into your Power BI dashboards. Our solutions help you discover hidden patterns, detect anomalies, and predict future trends before they happen. With advanced forecasting, you can stay ahead of market shifts, customer behavior changes, and potential risks. This helps your business make proactive, strategic decisions and drive sustainable growth — all powered by real-time, AI-driven insights.

At the end of the day, it's all about making the right decisions — and we make that simple for you. Our Power BI dashboards turn complex data into clear, easy-to-read charts, reports, and trend visuals. Decision-makers get the insights they need, without drowning in spreadsheets. We help you spot patterns, track performance, and make well-informed choices that move your business forward.

Data security is non-negotiable, and we take it seriously. Our Power BI services ensure your data is protected with advanced security measures like role-based access, encryption, and full compliance with standards such as GDPR and HIPAA. We help you safeguard sensitive business and customer information while meeting all legal and regulatory requirements. This builds trust, reduces risks, and keeps your data safe — always.
Industries We Serve
Discover the diverse range of industries we proudly support with our innovative software solutions to companies of different business verticals. Our expertise spans multiple sectors, ensuring tailored services for every unique need.


Featured Insights
Frequently Asked Questions
A power BI dashboard, also called a canvas, is a single page that presents all your data and reports. It is an entryway to all datasets and visualizations and is used for overall monitoring at a glance. Power BI Desktop plays a crucial role in this process, enabling the connection to data sources, transforming data into rich interactive Power BI dashboards, and automating time-consuming manual processes. It empowers end users by creating intuitive interactive visuals and uncovering hidden insights, making it an essential tool in creating and managing Power BI dashboards.
Power BI is a powerful business intelligence tool that can be used for creating interactive visualizations from a variety of data sources in the cloud or on-premises.
If a new update is available from the official team, the Power BI app automatically updates itself to the latest version. You can also check the current version of your Power BI – go to File->Help->About. You can click on ‘Updates’ from ‘Options and Settings’ to get a notification when your app requires an update.
A Power BI report consists of a single visual or pages with many visuals. It showcases a multi-perspective view of a dataset with different findings and insights.
Paginated reports are pixel-perfect, well-formatted, and meant to be shared or printed. They are designed to fit well on a page.
Data Analysis Expressions (DAX) is a library of functions, operators, and constants that can be used in formulas, expressions, and calculations in Power BI.
A Power BI Slicer can be used to sort and filter data in a table or Pivot Table. Slicers are a type of on-canvas visual filter.
The cost of hiring a Power BI consultant varies based on expertise, project complexity, and duration. Rates typically range from $25 to $100 per hour or a fixed project cost depending on scope. Enterprise-level projects may require custom pricing.
A Power BI consultant helps you Unify data from multiple sources for a centralized view and build real-time dashboards for quick decision-making. It can also help in implementing AI-powered insights to detect trends and patterns.
Power BI is beneficial across industries like:
- Retail & eCommerce – Sales analysis and inventory tracking.
- Healthcare – Patient data visualization and compliance reporting.
- Finance & Banking – Risk assessment and fraud detection.
- Manufacturing – Supply chain and production monitoring.
- Education – Student performance tracking.
Implementation time varies based on requirements. A small project usually takes 1 to 4 weeks, and a medium complex project takes 3 to 6 months. While an Enterprise-level solution demands 10 – 12 months and more.
Yes, Power BI integrates seamlessly with:
- Microsoft ecosystem (Excel, Azure, SharePoint, Dynamics 365)
- Cloud & On-premise databases (SQL Server, AWS, Google BigQuery)
- Third-party tools (Salesforce, SAP, Oracle, HubSpot, QuickBooks)
When companies offer power BI consulting services, they always assures after service support in which they provide troubleshooting & bug fixes, Performance monitoring & optimization, Feature updates & enhancements and user training & workshops.
Yes, Power BI can handle big data efficiently using Azure Synapse & Power BI Premium for scalability, DirectQuery & Aggregations to manage large datasets and through AI-driven insights & optimizations for performance tuning.
Look for a consultant who has certified Power BI experts, Understands your industry-specific needs, Provides end-to-end consulting (from setup to optimization), Offers post-implementation support and has a proven track record with case studies & client reviews. SPEC INDIA would be a perfect fit for you.
Let’s get in touch!
India
SPEC House, Parth Complex, Near Swastik Cross Roads, Navarangpura, Ahmedabad 380009, INDIA.
-
 +91-79-26404031, 32-33-34
 -
 [email protected]
