

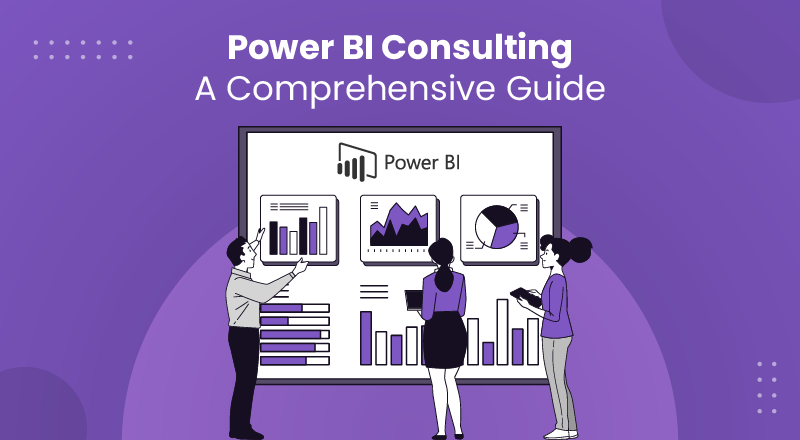
Power BI Consulting: A Comprehensive Guide
February 6, 2023
Business intelligence (BI) services are key drivers in today’s digital business world, and there is no looking back. Modernized data is the king and extracting insightful information from hordes of complex data is what BI looks at. Revenue in the Business Intelligence Software segment is projected to reach US$25.73bn in 2023.
Microsoft Power BI is one of the most popular business intelligence tool that offers robust data visualization and reporting competencies. With the importance of getting valuable information out of data increases, the need for Power BI consulting is on an exponential rise. Going by Microsoft best practices, Power BI consulting companies offer Microsoft Power BI consulting services that leverage the technology for your business.
This comprehensive guide aims to explore all essential facets of Power BI consulting. Prior to that, let us first understand the technology, and the spectrum of features that it offers, and then move on to the details of what Power BI consultants do and how they garner optimal business results.
What is Microsoft Power BI?
Turn your data into immediate impact with Microsoft Power BI. Do more with less using an end-to-end BI platform to create a single source of truth, uncover more powerful insights, and translate them into impact.
Empowered by the tech giant Microsoft, Power BI has been a favorite for many organizations, as their preferred reporting and analytics tool. The exceptional user experience that it offers, along with the interactive and self-service visualization capabilities is what puts it a step ahead of the rest. Businesses have a great opportunity to view their data with a different perception and extract desired information themselves, in their desired formats.
Power BI is a collection of software services, apps, and connectors that work together to turn your unrelated sources of data into coherent, visually immersive, and interactive insights. Your data may be an Excel spreadsheet or a collection of cloud-based and on-premises hybrid data warehouses. Power BI lets you easily connect to your data sources, visualize, discover what’s important, and share that with anyone or everyone you want.
Source: learn.microsoft.com
It is a collaborative data visualization tool that encourages sharing of data within business units and helps in making faster and better choices. There is a total 360-degree view of the business that gives access to visually appealing dashboards and personalized reports.
As a cost-effective, cloud-based BI and analytics tool, Power BI showcases an assortment of services, software, apps, and connectors amiably working to gather data from hundreds of disparate sources, transforming them into insightful information. It maintains all important metrics in a single place, with real-time updates and access to all types of devices.
Power BI Features
Below listed are the salient features and major causes why Power BI consulting has been earning so much popularity and wide utilization.
- Competence to bring data from all major data sources
- Centralization of data into a single location
- Drag and drop interface with drill-down facility
- Easy compatibility with AI and ML
- Hybrid deployment support
- Self-service mechanism
- Effective APIs for customization and integration
- Filtration of various datasets
- Flexible tiles and navigation panes
- Natural language Q&A box
- Ad hoc reporting and analysis
- Interactive geo-mapping
- Online Analytical Processing (OLAP)
- In-memory analytics with columnar database
- DAX scripting for measures and columns
- User-defined alerts as desired
Salient Benefits of Power BI
There are a lot of Power BI benefits, that serve as a reason to be a popular technology in the world of business intelligence and analytics.
- Fast and self-service processing of data
- Enhanced operational accuracy and actionable insights
- Responsive and quick real-time reporting
- Lesser costs and errors involved
- Automation of complicated enterprise reports
- Powerful dashboard graphs and report visualization
- Easy sharing of information across devices and the web
- Lesser dependency on IT staff
- Increased visibility and control over data elements
- Spot trends and patterns with AI visualization
- Regular updates and support structure
Different Power BI Solutions
Power BI comes up with different types of solutions, organizations can choose their desired option based on parameters like budget allocation, project deadlines, available skilled resources, etc. Here are the different options:
Power BI Desktop/Online:
A free BI solution for connecting and visualizing data and creating reports, only for personal use.
Power BI Pro:
an individual, paid user license for users to connect and interact with dashboards and live reports with other Power BI pro users.
Power BI Premium:
A per-user-based license, enterprise-level SaaS product, with wider functional and performance accessibility, advanced AI, and simple data management facilities for larger data sets.
Power BI Mobile:
Power BI-based native mobile BI apps for Android, iOS, and Windows. Easy to access and view dashboards from anywhere, anytime. Creates a dynamic environment with a complete view of data from any location, at any time.
Power BI Embedded:
Direct creation and deployment of data visualization into apps and web pages. Brings data to life with speed and efficacy. Leveraging the power of embedding for better interaction and sharing of dashboards and reports.
What is Power BI Used For?
Power BI is majorly used by organizations to extract meaningful data and gain actionable insights into it, through a variety of enriched dashboards and reports. It can take into consideration various data sources, removing all unwanted data and taking only the bulk of data that can be useful.
It not only helps users see what has happened in the past and what is happening today but also helps them view what may happen in the future. Since it is well integrated with AI and ML capabilities, it can spot trends, forecasts, and patterns to make up-to-date predictions.
On a general note, Power BI is meant for those who want to leverage their huge data bulks and are in search of increased reporting and analytical competencies. It offers wide data integration, reporting, and visualization competencies with data independence across business units.
Integration Capabilities of Power BI with Other Microsoft Products
Microsoft is a huge family of tools and technologies. Power BI offers great integration capabilities to popular technologies from the Microsoft stack, bringing in increased collaboration, results, and innovation. Power BI connects seamlessly to the below-mentioned Microsoft tools, widening its reach, and fastening business agility:
Power Apps:
Creation of apps in a few hours, with fast data connection and execution on iOS, Android devices, and the web
Dynamics 365:
A Microsoft product for ERP and CRM applications with multiple services and connected applications in a collaborative manner
Azure Synapse Analytics:
Native integration with Power BI for faster decision-making and delivering a secure platform with optimized pipelines
Azure Databricks:
Efficient analysis of data with security, ELT processes, and creation of robust AI solutions
Azure Machine Learning:
Cloud-based, a predictive analytical platform to create ML models with ease and easily integrate with Power BI solutions
Office 365:
Power BI is well integrated with Office 365 and gets a good response from Microsoft for data visualization, works well for SMBs and startups
SharePoint:
The collaborative power of SharePoint combines well with visualization tools in Power BI to offer enriched reports, charts, and other visual outputs
Project Online:
Flexible prebuilt solutions by Microsoft, with Power BI transforming data into valuable reports for spotting trends and catalyzing business processes.
Power BI Excel Integration:
Centralize data, share real-time visual reports, and have a seamless interaction with Power BI publisher.
SQL Server:
Power BI can increase the competence of SQL servers for better reporting, analysis, data management, migration, and data integration.
What is Power BI Consulting?
Power BI consulting services include an end-to-end consultation to organizations, leveraging all the aspects of Power BI and implement Power BI components to overcome the hurdles faced by the organization. Power BI consulting includes offering a thorough insight into the organizational data through dashboards and visualizations with the help of Power BI components.
Power BI consultants assist in defining the BI strategy, implementing infrastructure, and transforming data into robust Power BI applications. They also help in implementing Microsoft BI technologies, advanced DAX calculations, complicated data modeling, customization of the Power BI platform, data source integration, and sharing of insights within the organization.
Microsoft Power BI consulting services offer advantages to businesses, as below:
- Enhance decision-making, business process execution
- Drive new opportunities for sales, revenue, and profits
- Stay a step ahead of the rest
- Extract market patterns, trends, and future outcomes
- Identify business issues, and risks and offer solutions to avoid failures
- Revolutionize, analyze, and visualize data
- Undergo ETL and ELT processes
- Fasten analytical services with increasing data
Key Power BI Consulting Services
Power BI consultants offer a wide range of service offerings, unlocking the potential of Power BI. There could be a mix and match of these services, depending upon the Power BI consulting company and its choices.
The major Power BI services encompass the following service areas:
Power BI Planning and Consultation:
The basic requirement for business intelligence is identified by the Power BI consultants, after which a thorough data analysis, planning, and strategy roadmap is worked upon. Various supporting tools are analyzed, existing systems are evaluated, and the most suitable tools are chosen.
Power BI Designing, Data Visualization & Reports:
A comprehensive design is drawn up by the design experts that includes innovative visualization charts, personalized dashboard design, report and schema design, user-defined designs, etc. Users can view reports from any device, anytime from anywhere, and that too from multiple datasets. A variety of metrics and KPIs can also be viewed explicitly.
Power BI Advanced Analytics:
Power BI Advanced Analytics takes care of data modeling and offers detailed analytics for taking business decisions and making data-driven alterations by foreseeing future requirements. Data scientists can leverage analytics through R and Python scripts, and DAX (Data Analysis Expressions) with AI & ML capabilities, from which different predictive models like Azure Predictive Analytics can be created. In-depth data patterns can be unveiled.
Power BI Development and Implementation:
Once the design is in place, a proper development process takes place with Microsoft BI and its family of products through which various analytical reports and dashboards are generated. Prior to this, it also includes administering the ELT/ETL and SSIS/SSRS/SSAS processes.
Power BI Integration Services:
Once the main project is done, it is important to ensure that the project seamlessly integrates with all supporting technologies like Dynamics 365, SharePoint, Excel spreadsheets, Power Apps, GitHub, etc. Users can extract insightful information, explore data, and get the availability of different data sources through different Power BI integration models.
Power BI QA, Training & Managed Support:
Then comes the testing and QA activity that includes various types of testing like data uniformity testing, data load testing, performance testing, load testing, etc. Different BI reports get generated in the testing phase which helps. A proper training schedule and round-the-clock support and maintenance are offered as per norms. Training could include rapid training, real-world training, and different certification programs.
Hire Dedicated Power BI Developers:
Hiring Power BI resources can be advantageous to business since it brings along expertise, flexibility, cost-effectiveness, timeliness, and scalability. Hiring dedicated Power BI developers from experienced organizations can bring in faster results.
Power BI Governance and Implementation:
There are flexible and standardized plans and regulations like HIPAA, that are made based on the norms followed by the organization. This helps the projects in adhering to the government rules and thereby fasten the implementation track, after getting the HIPAA data. Different Power BI deployment strategies and data certifications can be implemented based on the system governance model. The entire HIPAA data can be thoroughly analyzed in Power BI.
Power BI Migration:
If users wish to migrate from their legacy systems or third-party tools to Power BI, it can be easily managed through a proper roadmap that the Power BI consultants could prepare and execute. They can establish a basic BI architecture and migrate the entire system comfortably, with a proper plan in place.
What are Power BI Dashboards and Power BI Reports?
Power BI Dashboards:
The visually appealing dashboards generated by Power BI are highly competent, flexible, and comprehensive to keep full track of all key metrics. It considers all associated data sources and integrates them seamlessly to offer a consolidated output. It combines cloud-driven data and on-premises data, offering an interactive and real-time dashboard, which can be operated by one and all.
Power BI developers create these dashboards with Power BI, offering a 360-degree view of what is happening and thereby, helping the business in making faster and more accurate decisions. They also aid in data modeling, data manipulation, machine learning, and smart data management. There is data drill-down facility and drag-and-drop provision to drill down further deep into the dashboards.
Power BI Reports:
Power BI reports offer a snapshot of your operations with a unique viewpoint of data through tables, charts, graphs, etc. There can be interactive reports generated based on time – day-wise, month-wise, year-wise, based on different parameters that can be chosen by the users.
User-defined filters can be implemented to showcase only some sections of the data, as needed. It is a combination of various visual components like charts, texts, and values on a page. Data can be sliced/diced, a multi-page canvas can be shown, bookmarks and matrices can be displayed and there can be seamless integration with dashboards.
Though both the terminologies – Power BI dashboards and Power BI reports sound synonymous, they have their own individual set of characteristics that sets them apart.
Good Read: Power BI Dashboard vs Reports – A Vivid And In-Depth Comparison
Paginated Reports in Power BI:
Paginated reports in Power BI offer pagination of reports with pixel-perfect formatting and fitting on multiple pages. Also called many-paged reports, they are based on Report Definition Language (RPL). The report layout on each page can be easily managed and controlled through the tool.
Power BI Paginated Report Builder is the tool that prepares the definition of paginated reports. The Report Processor merges it with the layout and the Report Builder shows the preview of the report. This later can be published to the Power BI service. These reports are fit to print and generate a PDF file.
Data can be availed from different data sources like SQL Server, Azure, Oracle, Power BI Premium datasets, etc. Reports can easily be shared and printed across multiple users. They can also be exported to different usable formats. Power BI developers can incorporate interactive features and images to enhance visualization.
Good Read: Paginated Reports In Power BI – All You Need To Know
What Is DAX In Power BI?
Data Analysis Expressions (DAX) is a consolidated library with a set of functions, operators, and constants in Power BI that can be utilized as formulas for the calculation of different values. There are over 200 components that help in extracting needed results. It can create formulas and expressions in Power Pivot, Power BI, and Analysis Services.
DAX in Power BI is a syntax language with a high-end capability for managing and manipulating data. There is faster data processing with smarter dashboards. It syncs well with other Microsoft products too. It offers advanced calculations for better query results. There is an enhanced user experience, and it leverages the capabilities of Power BI.
Some of the major types of Power BI DAX functions are mathematical functions, statistical functions, financial functions, logical functions, relationship functions, information functions, and more.
Want to know more about DAX in Power BI, click here.
Top Power BI Visuals
Power BI offers a variety of visual components, making it a likable tool. Here are some of them:
Power BI Charts:
Most widely used reports and dashboards are interactive, and flexible and offer different perceptions with ease. There could be area charts, bar and column charts, doughnut charts, line charts, and pie charts.
Power BI Cards:
Utilized for showing single or multiple data points in a one-per-row format. Single card to highlight a single number that is important and Multi-card to show one or more data points that are important.
Power BI Maps:
Integrates with Bing maps for default map coordinates. Creates map-based visualizations with a detailed view of spatial and categorical data. It could be a Basic map, ArcGIS map, Azure map, or a Shape map.
Power BI Slicer:
A type of Power BI output on canvas visual filters for helping users in sorting and filtering reports and choosing information as needed.
Power BI Table:
One of the most common ways of showing quantitative data. Displays numeric, quantitative, and exact precise values in tabular format.
Power BI KPI:
A visual hint showing graphical measures of performance through key performance indicators.
Interesting in knowing more about Power BI Visuals, read this.
Hire Power BI Developer: A Service Offering Great Advantages
Hiring developers is a much-in-demand service area that has been increasing in popularity over the years. Organizations now look to hire Power BI developers, since that offers a lot more advantages than recruiting in-house developers.
Power BI consulting organizations are well-equipped with Power BI developers who display effective skills, discipline, collaboration skills, adherence to standards, and project deadlines. Hiring can be done based on the need for Power BI developers at the time of the project. It could be through a pay-as-you-go model, on an hourly basis, weekly basis, or monthly basis.
There are dedicated Power BI consulting companies that offer resources that have extensive experience, work as partners, need no training, offer round-the-clock support, and help in maximizing business RoI.
Case Studies: Bringing Data to Life with Power BI Consulting
Gain a deeper understanding of Power BI consulting services and its capabilities through the below case studies, a few of the lot, which can offer a wide range of perspectives:
- Sales Performance Dashboard: Visualizing overall information related to sales, decisions based on analytics, and for management to improve strategic planning.
- Time Tracking Dashboard: Showing the amount of time spent by the employees, on different activities, monitoring information like how much personal time is spent, how much is daily productivity and efficiency, which tasks take how much time, etc.
- Social Media Analytics Dashboard: Representing the analysis of social media performance for various platforms like Facebook, Twitter, and LinkedIn.
On a Concluding Note:
Microsoft Power BI is a powerhouse in the world of business intelligence tools. Power BI consulting services are in great demand, especially when it comes to leveraging the complete potential of this wonderful technology. Getting efficient Power BI consultants from good firms can help big-time in maximizing revenue and getting the best efficacy in the organization.
There are many benefits of Power BI for which organizations hire Power BI developers from well-known software consultants. Having an experienced and expert Power BI consulting partner can be of great assistance in understanding your visualization needs and converting them into actionable insights through the features of Power BI.
The above well-curated Power BI guide has attempted to cover almost all aspects related to Power BI as a technology and Power BI consulting as a service area. Microsoft Power BI consulting services have a bright future as they, seamlessly, convert your business requirements into interactive reports, useful dashboards, and attractive data visualizations.
SPEC INDIA is your trusted partner for AI-driven software solutions, with proven expertise in digital transformation and innovative technology services. We deliver secure, reliable, and high-quality IT solutions to clients worldwide. As an ISO/IEC 27001:2022 certified company, we follow the highest standards for data security and quality. Our team applies proven project management methods, flexible engagement models, and modern infrastructure to deliver outstanding results. With skilled professionals and years of experience, we turn ideas into impactful solutions that drive business growth.
Delivering Digital Outcomes To Accelerate Growth
Let’s TalkDelivering Digital Outcomes To Accelerate Growth
Let’s TalkDelivering Digital Outcomes To Accelerate Growth
Let’s TalkRelated Guides
Let’s get in touch!
India
SPEC House, Parth Complex, Near Swastik Cross Roads, Navarangpura, Ahmedabad 380009, INDIA.
-
 +91-79-26404031, 32-33-34
 -
 [email protected]
